Dashboards
Overview
Dashboards in IoTBreeze provide a powerful way to visualize and monitor your IoT data in real-time. Each dashboard can display multiple widgets showing data from your connected devices (Things), allowing you to create customized views tailored to your specific monitoring needs.
Key features include:
- Multiple Widget Types - Display data in various formats including charts, maps, properties and more
- Real-time Updates - Configure automatic refresh intervals to keep data current
- Hierarchical Organization - Organize dashboards in a tree structure for easy navigation
- Asset-based - Each dashboard is associated with one or more Things to display their data
- Group Access Control - Manage who can view and edit dashboards through group assignments
- Flexible Layouts - Arrange widgets to create the perfect monitoring interface
Creating a Dashboard
To create a new dashboard, navigate to the Dashboards section and click the "+" button. You'll need to configure the dashboard properties as described in the Dashboard Hierarchy documentation.
Required Configuration
When creating a dashboard, you must specify:
| Field | Required | Description |
|---|---|---|
| Name | ✅ Yes | Unique identifier for the dashboard. |
| Assets | ✅ Yes | Select one or more Things to display data from. |
| Hierarchy | ❌ No | Optionally assign to a hierarchy for tree-view organization. |
| Groups | ❌ No | Control access by assigning groups. |
For detailed information on dashboard creation and hierarchy organization, see the Dashboard Hierarchy documentation.
Empty Dashboard
When you first create a dashboard or if no widgets have been added, you'll see an empty state:
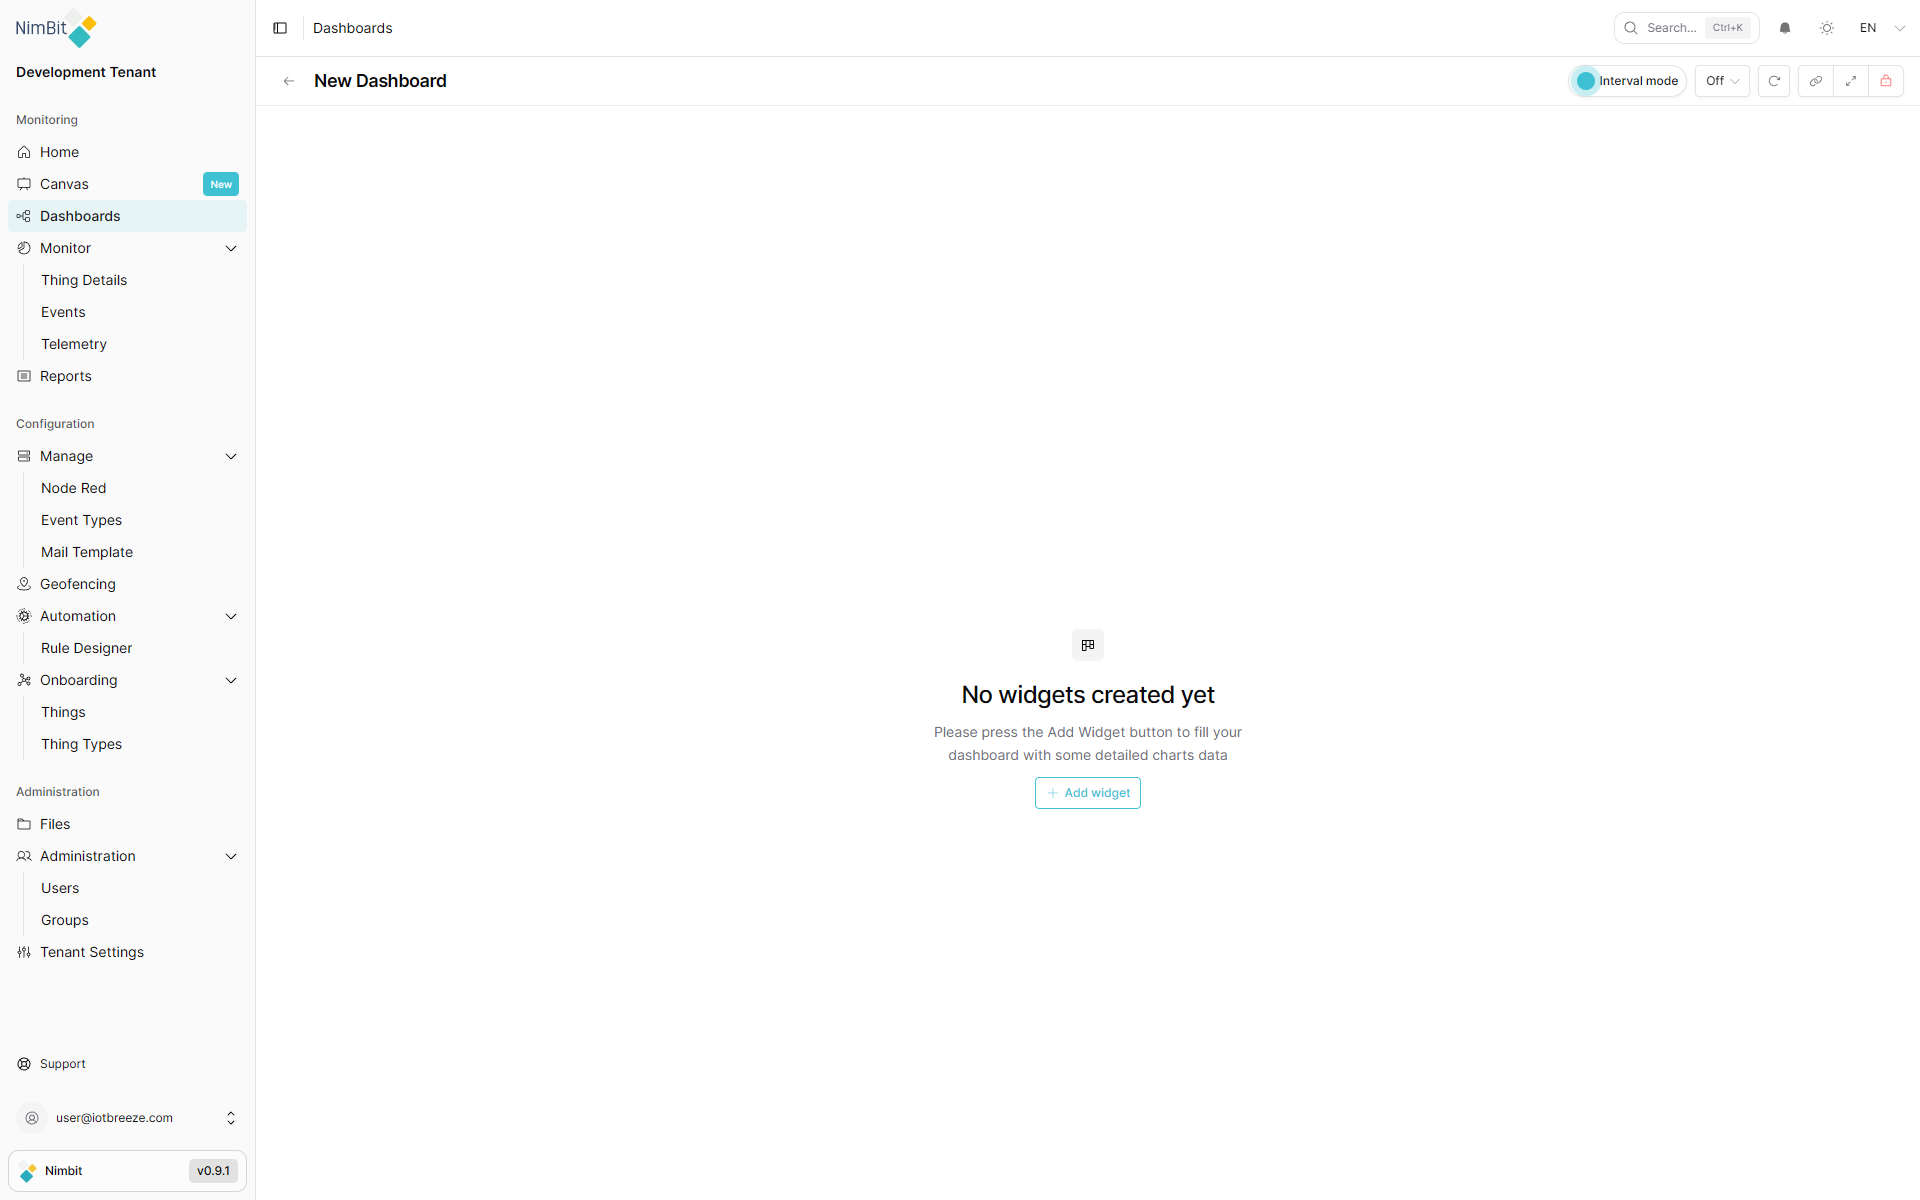
This clean slate is ready for you to add widgets that will display your Thing data.
Adding Widgets
Widgets are the building blocks of your dashboard, displaying different types of data and visualizations from your selected Things.
Enabling Edit Mode
Before you can add or modify widgets, you must enable editing mode:
- Click the lock button in the dashboard toolbar (appears red when locked/inactive)
- Once unlocked, editing controls become visible:
- "+" button (toolbar) - Add new widgets
- Import button (toolbar) - Import widget configurations
- Edit button (toolbar) - Edit dashboard properties
- Widget controls (top-right corner of each widget) - Edit, delete, or configure individual widgets
- Drag handles - Move and rearrange widgets on the dashboard
Some widgets may display action buttons (like fullscreen) in their top-right corner even when editing is disabled. Widget edit controls only appear when the dashboard is unlocked.
Widget Selection
With editing mode enabled, click the "+" button to add a new widget. A selection dialog appears showing all available widget types:
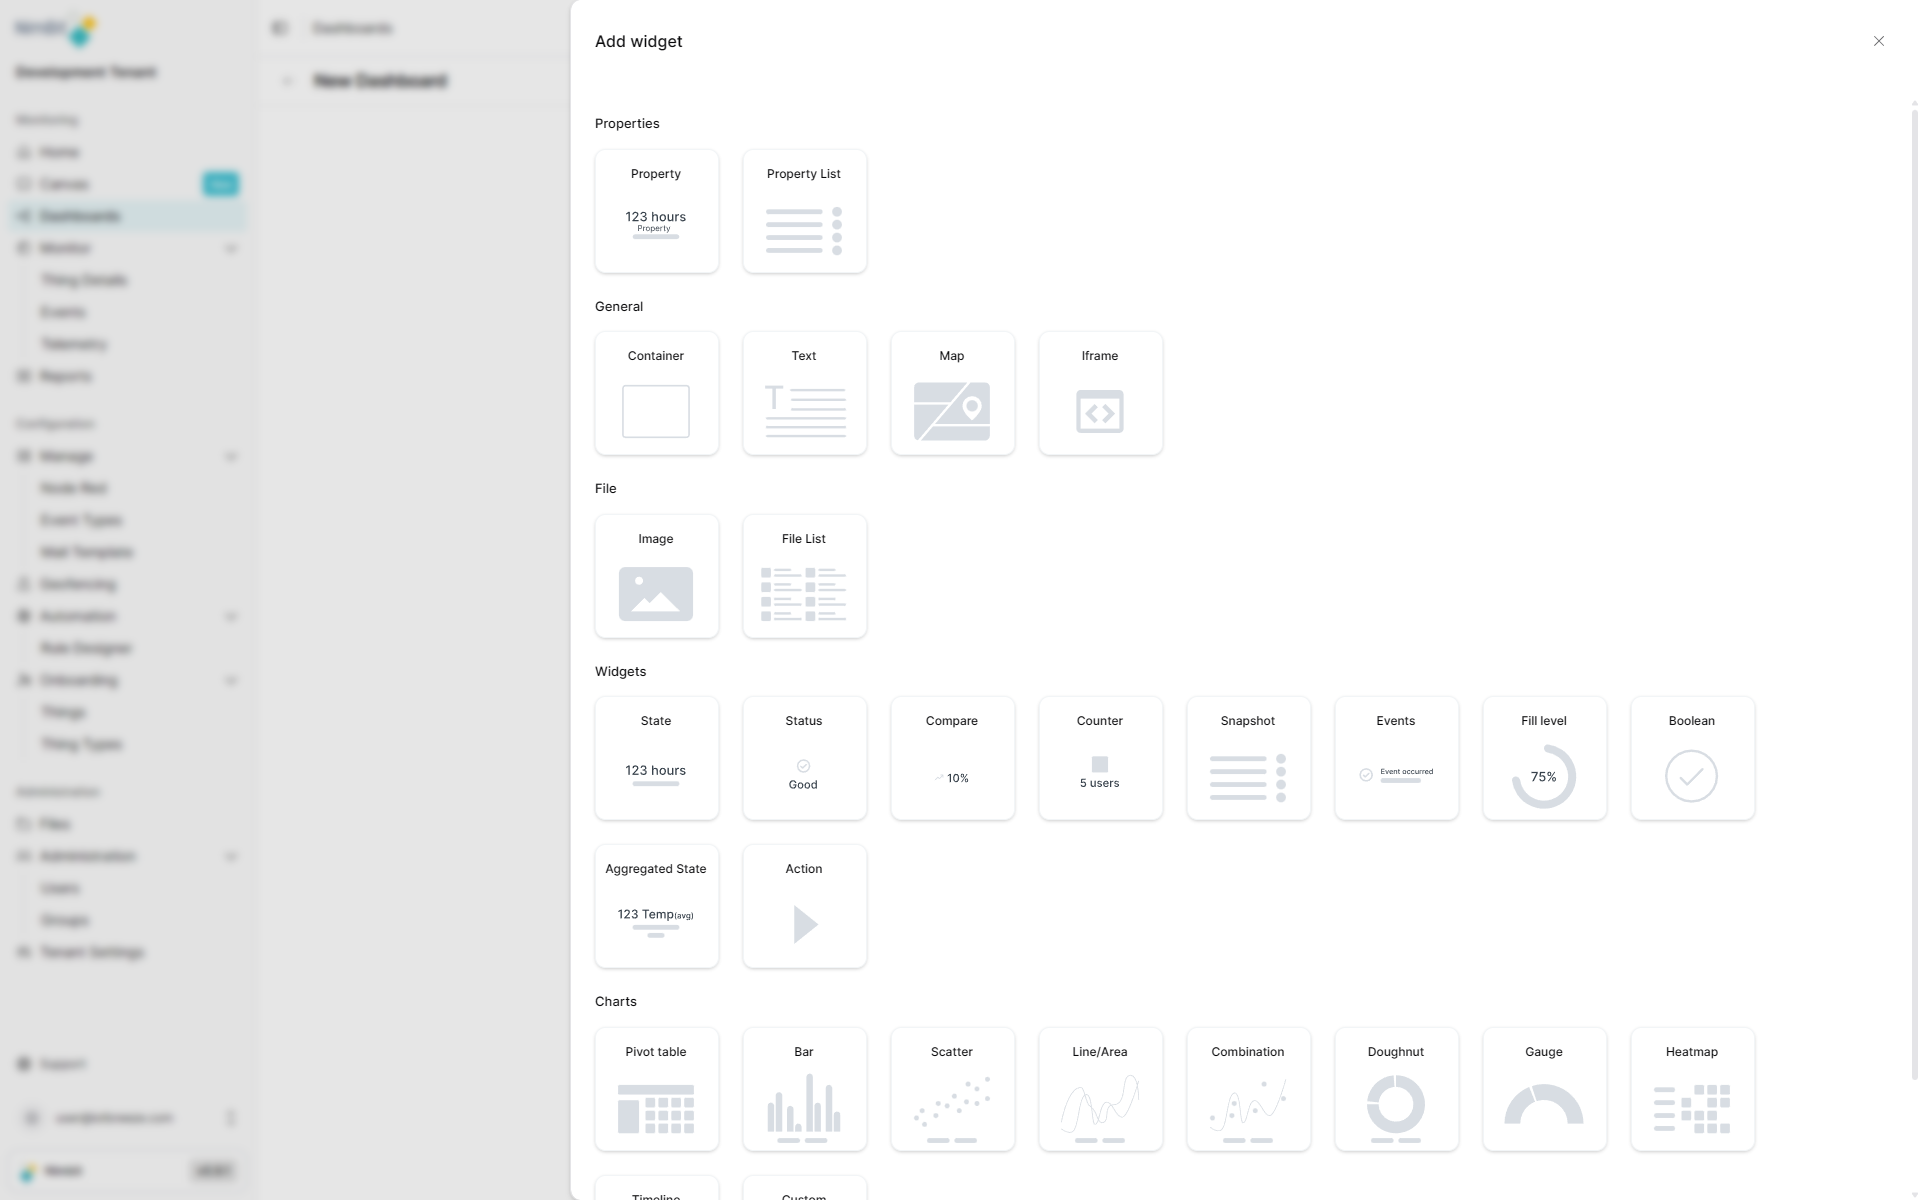
Available widget types include:
Not all widgets are available for every dashboard type. The available widgets depend on the dashboard context:
- Thing/ThingType Dashboards - May have limited widget selection specific to device data but mostly complete
- Dashboard Hierarchy - Most widget types available
- Reports - Widgets optimized for reporting and data export
- General Dashboards - General-purpose widgets for organizational views
The widget selection dialog will only show widgets compatible with your current dashboard type.
Data Display Widgets:
- Pivot Table - Tabular display with rows and columns that groups and aggregates data by various dimensions. Perfect for analyzing large datasets, creating cross-tabulations and quick summaries. Allows pivoting data fields for different views.
- Property - Show individual Thing property values with current state.
- Property List - Display multiple properties in a table format with their current states.
- Snapshot - Capture and display a point-in-time view of selected data.
- File List - Display and manage files associated with Things.
Status & State Widgets:
- State - Display current state of a measure with visual indicators.
- Status - Show status information with color-coded indicators.
- Aggregated State - Display aggregated state information across multiple data points or Things.
- Compare - Compare values across different time periods or Things side-by-side.
- Boolean - Display boolean values with clear on/off or true/false indicators.
- Counter - Show numerical counters with increment/decrement capabilities.
Chart Widgets:
- Bar - Horizontal or vertical bars whose length/height represents values. Ideal for comparing categories, displaying rankings and visualizing discrete data. Works best for few categories with clear differences.
- Scatter - Points in a coordinate system where X and Y axes represent different variables. Use to identify correlations between variables, detect outliers and uncover trends and patterns in data.
- Line - Connected data points as a line. Perfect for displaying time series, showing trends over periods and visualizing continuous data development.
- Combination - Combines different chart types (e.g., bars + line) with different Y-axes. Use to display different metrics with varying scales simultaneously and visualize complex relationships.
- Doughnut - Ring chart with segments showing proportions of a whole, with empty center. Use for percentage distributions, visualizing shares and can display additional information in the center.
- Gauge - Semi-circular scale with pointer, similar to a tachometer. Use for displaying KPIs and performance indicators, comparing target values with current values and status dashboards.
- Heatmap - Matrix of color-coded cells where color intensity represents values. Use to identify patterns in large datasets, display correlation matrices and visualize geographic or temporal distributions.
- Timeline - Horizontal or vertical line with events marked in chronological order. Use to display project plans, show historical developments and visualize milestones and deadlines.
- Fill Level - Visual representation of fill levels or capacity, often displayed as tank or container graphics.
- Custom Chart - Create custom visualizations with user-defined chart configurations and data representations.
Interactive Widgets:
- Events - Display and manage events from your Things with timestamps and details.
- Action - Execute actions on Things directly from the dashboard with configurable buttons and controls.
Visual & Media Widgets:
- Image - Display static images or graphics.
- Canvas - Free-form drawing and annotation canvas for custom visualizations.
Layout & Navigation Widgets:
- Container - Group multiple widgets together for organized layouts and visual hierarchy.
- Text - Display static text, labels, descriptions, or instructions.
External Content Widgets:
- Map - Visualize Thing locations geographically on an interactive map.
- Thing List Map - Display multiple Things on a map with list view for navigation.
- iFrame - Embed external content from other applications or websites.
Detailed documentation for each widget type is available in the Widgets section.
Refresh Settings
Dashboards can automatically refresh to display the latest data from your Things. Configure the refresh behavior to match your monitoring requirements:
Refresh Modes
Dashboards support two refresh modes:
| Mode | Description |
|---|---|
| Interval Mode | Dashboard refreshes at the defined refresh interval. You can temporarily change the refresh time while interval mode is selected. |
| Live Mode | Dashboard continuously updates with real-time data without fixed intervals. |
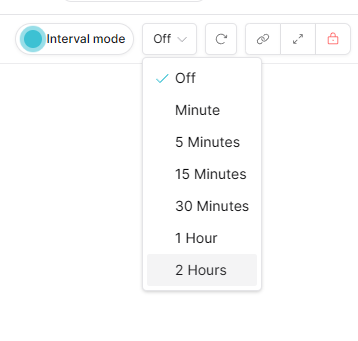
Configuring Refresh
You can set the refresh configuration when creating or editing a dashboard:
| Setting | Description |
|---|---|
| Refresh Mode | Choose between Interval Mode or Live Mode. |
| Refresh Interval | Set how frequently the dashboard updates (in seconds) when using Interval Mode. |
| Manual Refresh | Users can always manually refresh regardless of automatic refresh settings. |
Choose an appropriate refresh interval based on:
- How frequently your Thing data updates
- Network bandwidth considerations
- Dashboard complexity and number of widgets
- User monitoring requirements
For critical real-time monitoring, use Live Mode. For standard monitoring with less frequent updates, use Interval Mode to reduce network load.
Dashboard Features
Real-time Monitoring
Dashboards provide real-time visibility into your IoT devices:
- Live Data - See current values from your Things
- Historical Trends - View data over time with appropriate widgets
- Status Indicators - Monitor device health and connectivity
- Alerts & Notifications - Stay informed of important events
Responsive Design
Dashboards automatically adapt to different screen sizes:
- Desktop - Full-featured interface with maximum screen real estate
- Tablet - Optimized layout for medium screens
- Mobile - Streamlined view for on-the-go monitoring
Customization
Tailor each dashboard to your specific needs:
- Widget Arrangement - Drag and drop widgets to organize your layout
- Multiple Dashboards - Create different views for different purposes
- Asset Selection - Focus on specific Things or display data from multiple devices
- Access Control - Share dashboards with specific groups
Managing Dashboards
Editing Dashboards
To modify an existing dashboard:
- Navigate to the dashboard you want to edit
- Click the Edit button
- Update properties, add/remove widgets, or adjust settings
- Save your changes
Deleting Dashboards
To remove a dashboard:
- Navigate to the Dashboards list
- Select the dashboard you want to delete
- Click the Delete button
- Confirm the deletion
Deleting a dashboard is permanent and cannot be undone. All widgets and configurations will be lost.
Viewing Modes
Dashboards support different viewing modes:
- View Mode - Standard dashboard display for monitoring
- Edit Mode - Add, remove, or configure widgets
- Fullscreen - Maximize screen space for critical monitoring
Best Practices
Dashboard Design
- Purpose-Driven - Create dashboards with a specific monitoring goal
- Widget Efficiency - Only include widgets that provide value
- Logical Grouping - Group related data together using containers
- Clear Naming - Use descriptive dashboard names for easy identification
- Refresh Balance - Set refresh intervals appropriate to your data update frequency
Organization
- Use Hierarchies - Organize related dashboards in hierarchy trees
- Group Assignment - Control access appropriately through groups
- Asset Selection - Choose relevant Things for each dashboard
- Avoid Clutter - Keep dashboards focused and uncluttered
Performance
- Optimize Widget Count - Too many widgets can impact performance
- Appropriate Refresh - Don't set refresh intervals unnecessarily low
- Asset Filtering - Only include necessary Things in each dashboard
- Monitor Load - Be mindful of dashboard complexity on slower devices
What's Next?
- Dashboard Hierarchy - Learn about organizing dashboards
- Widgets Overview - Explore available widget types
- Create Things - Set up devices to display on dashboards