Canvas Widget
Overview
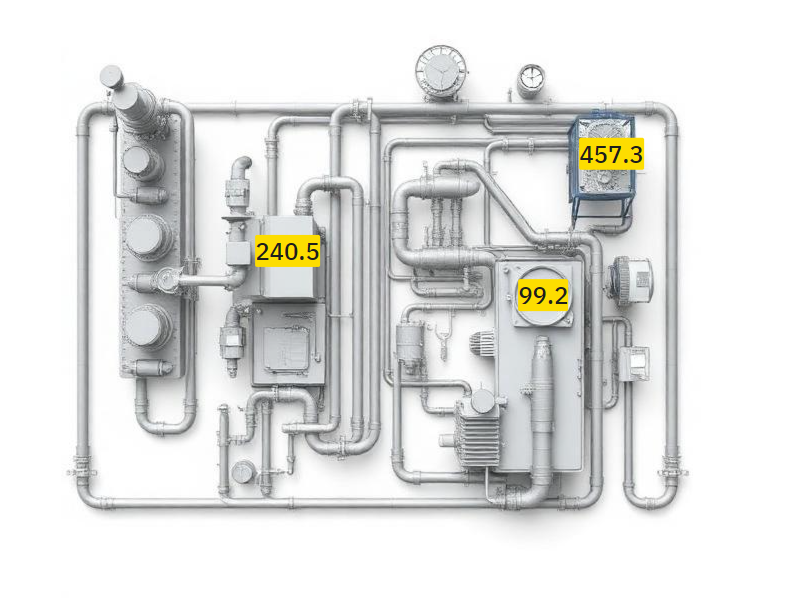
The Canvas widget displays a visual canvas that can be used to create custom diagrams, flowcharts, or visual representations of your IoT infrastructure. It references a Canvas object that contains the visual elements and layout.
Use Cases
- Custom Diagrams - Draw process flows or system diagrams
- Visual Design - Create custom graphics
Key Features
- Display custom canvas layouts
- Reference Canvas objects by ID
- Interactive canvas editor integration
- Thing Type association
- Customizable background and border
- Grid background for alignment
Configuration
The Canvas widget requires a reference to an existing Canvas object. The canvas must be created separately and associated with a Thing Type/Thing.
Basic Settings
| Field | Required | Description |
|---|---|---|
| Canvas | ✅ Yes | Select a Canvas object to display |
The Canvas selector shows canvases that match the dashboard's Thing Type and have type ThingType.
Display Options
| Field | Type | Description |
|---|---|---|
| Transparent | Boolean | Remove background (default: false) |
| Background Color | String | Custom background color |
| Border color | String | Custom border color |
Canvas Configuration
The referenced Canvas object contains:
- Canvas ID - Unique identifier for the canvas
- Name - Display name of the canvas
- Thing Type ID - Associated Thing Type
- Type - Dashboard type (typically
ThingType) - Visual Elements - Canvas content (shapes, text, connections)
Canvas Features
Visual Canvas Editor
The widget integrates with the Canvas Editor component, providing:
- Thing Integration - Link canvas elements to Thing data
- Real-time Updates - Canvas reflects current Thing states
Use Case Examples
Infrastructure Diagram
Create a visual representation of your IoT infrastructure:
- Network topology showing device connections
- Physical layout of sensors and actuators
- Data flow between components
Process Visualization
Visualize operational processes:
- Manufacturing process steps
- Data pipeline flows
- System state machines
Monitoring Layout
Build custom monitoring displays:
- Equipment status visualization
- Facility maps with sensor locations
What's Next?
- Container Widget - For organizing dashboard layouts