Overview
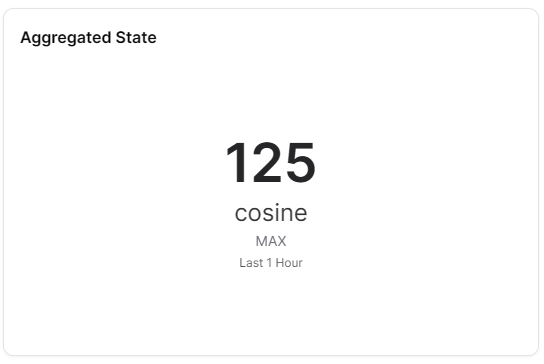
The Aggregated State widget displays aggregated state information across multiple data points or Things. It provides a consolidated view of states, useful for monitoring groups of devices or summarizing multiple measurements.
Use Cases
- Fleet Monitoring - Overview of multiple device states
- Group Status - Aggregate status for device groups
- Multi-Sensor Summary - Combined state from multiple sensors
- Facility Overview - Overall facility status from multiple sources
- Performance Summaries - Aggregated performance metrics
Key Features
- Multi-source data aggregation
- Configurable aggregation methods
- Time-based aggregation
- Visual state indicators
- Real-time updates
Configuration
Basic Settings
| Field | Required | Description |
|---|
| Name | ❌ No | Display name for the widget |
| Thing | ✅ Yes | Select Thing to aggregate from |
| Measure | ✅ Yes | Choose measure to aggregate (with id, measure, thingId) |
| Aggregation Method | ✅ Yes | Average, sum, min, max, count, etc. |
Timeframe Settings
| Field | Required | Description |
|---|
| Window | ✅ Yes | Time window configuration with type, from, to |
| Bucket | ❌ No | Bucket size for cumulative aggregations |
| Override | ❌ No | Use widget-specific time settings instead of dashboard defaults |
Display Options
| Field | Required | Description | Default Value |
|---|
| Mode | ❌ No | Display mode: 'carousel' or 'stacked' | - |
| Orientation | ❌ No | Layout: 'horizontal' or 'vertical' | - |
| Compact number | ❌ No | Display large numbers compactly | true |
| Gapfill | ❌ No | Fill gaps in data | - |
| Transparent | ❌ No | Remove widget background | false |
| Border color | ❌ No | Widget border color | - |
| Background Color | ❌ No | Widget background color | - |
Best Practices
- Meaningful Aggregation - Choose aggregation method that makes sense for data
- Device Grouping - Aggregate similar devices or measurements
- Time Periods - Use appropriate time windows for aggregation
- Trend Analysis - Compare aggregated states over time
- Clear Labeling - Indicate what is being aggregated
What's Next?