Overview
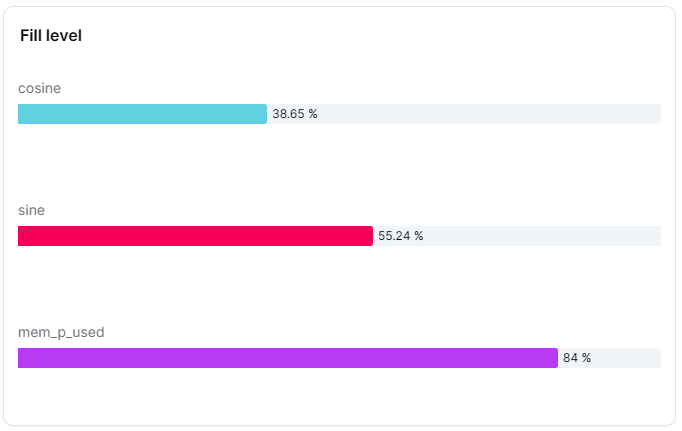
The Fill Level widget provides visual representation of fill levels or capacity, often displayed as tank or container graphics. It's ideal for monitoring liquid levels, capacity utilization and any metric representing fullness or completion.
Use Cases
- Tank Monitoring - Display liquid levels in tanks
- Storage Capacity - Show storage utilization
- Battery Levels - Visualize battery charge levels
- Completion Progress - Show project or task completion
- Inventory Levels - Monitor stock levels visually
Key Features
- Visual container representation
- Percentage or absolute value display
- Color-coded levels
- Threshold indicators
- Min/max markers
- Real-time updates
Configuration
Basic Settings
| Field | Required | Description |
|---|
| Name | ❌ No | Display name for the widget |
| Thing | ✅ Yes | Select Thing to monitor |
| Measure | ✅ Yes | Choose measure representing level (with id, measure, thingId) |
Level Settings
| Field | Required | Description |
|---|
| Min Value | ✅ Yes | Minimum level value |
| Max Value | ✅ Yes | Maximum level value (100%) |
| Warning Level | ✅ Yes | Warning threshold value |
| Critical Level | ✅ Yes | Critical threshold value |
| Color | ✅ Yes | Base color for the fill level visualization |
| Convert to Percentage | ❌ No | Display value as percentage |
Display Options
| Field | Required | Description | Default Value |
|---|
| Display mode | ❌ No | Container style: 'circular' or 'linear' | 'linear' |
| Transparent | ❌ No | Remove widget background | false |
| Border color | ❌ No | Widget border color | - |
| Background Color | ❌ No | Widget background color | - |
Best Practices
- Clear Thresholds - Set meaningful warning/critical levels
- Appropriate Scaling - Set min/max matching physical limits
- Color Coding - Use standard colors (green=safe, yellow=warning, red=critical)
- Units - Display units clearly (liters, gallons, %)
- Multiple Tanks - Use consistent styling across multiple tanks
What's Next?