Dashboard Hierarchy
Overview
Dashboard Hierarchy is a separate organizational structure that allows you to arrange your dashboards in a parent-child tree. Hierarchies and dashboards are distinct entities:
- Hierarchies organize dashboards in a tree structure with parent and child relationships
- Dashboards can optionally be assigned to a hierarchy
- Dashboards without a hierarchy are only visible in the table/list view, not in the tree view
- Multiple root hierarchies are possible, allowing different organizational trees
This hierarchical organization is particularly useful for:
- Grouping related dashboards by facility, department, or system
- Creating logical navigation paths through your data visualization
- Organizing dashboards from general overviews to detailed views
- Maintaining clear relationships between different levels of monitoring
Viewing Dashboard Hierarchy
Hierarchy View
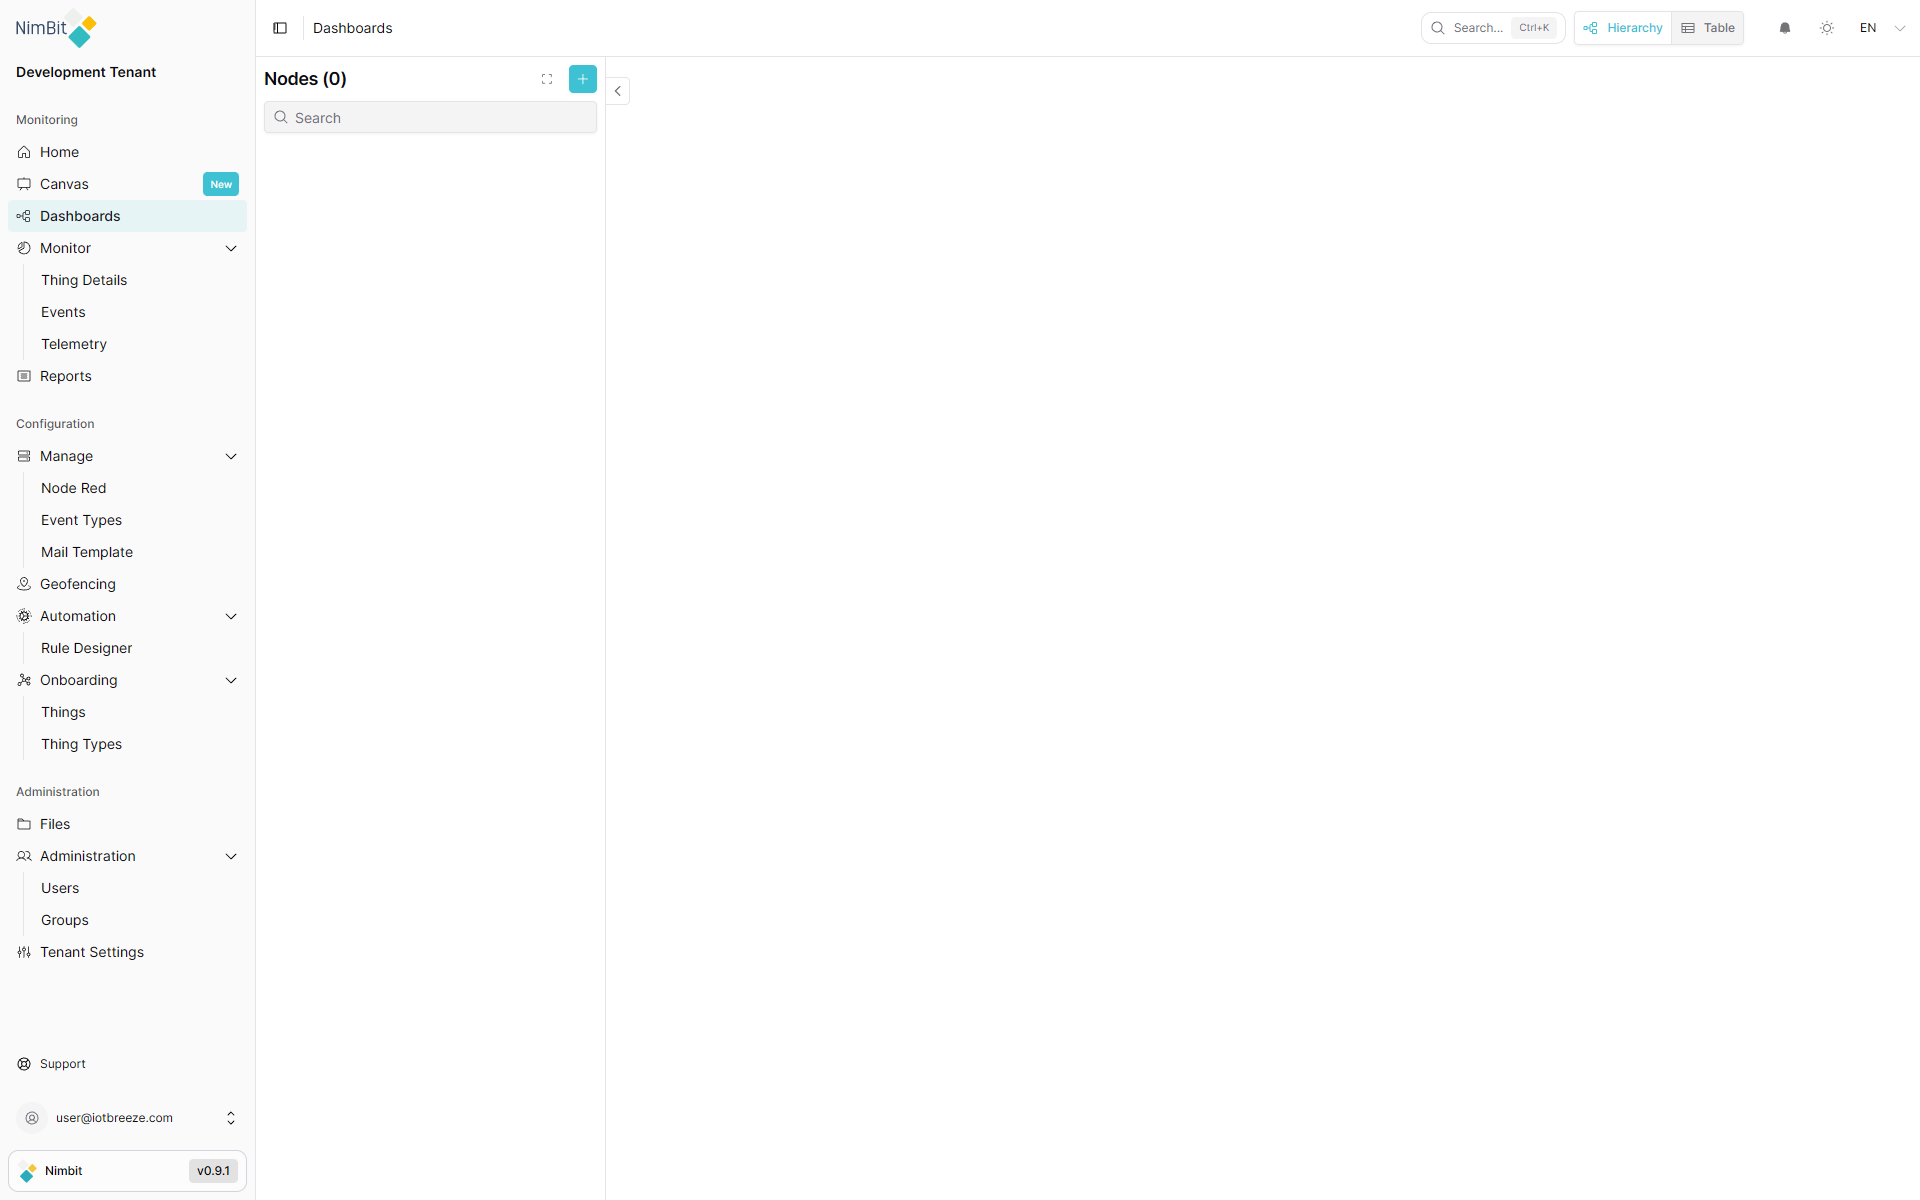
The hierarchy view displays your organizational structure as an expandable tree, showing the parent-child relationships between hierarchies and the dashboards they contain.
Empty State
When no hierarchies exist yet, the hierarchy view appears empty:
Populated Hierarchy
As you create hierarchies with parent-child relationships and add dashboards to them, the tree structure grows:
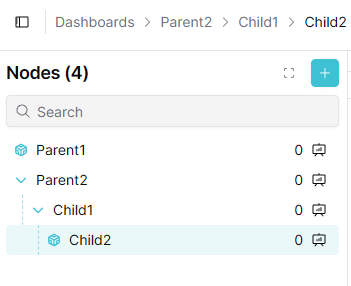
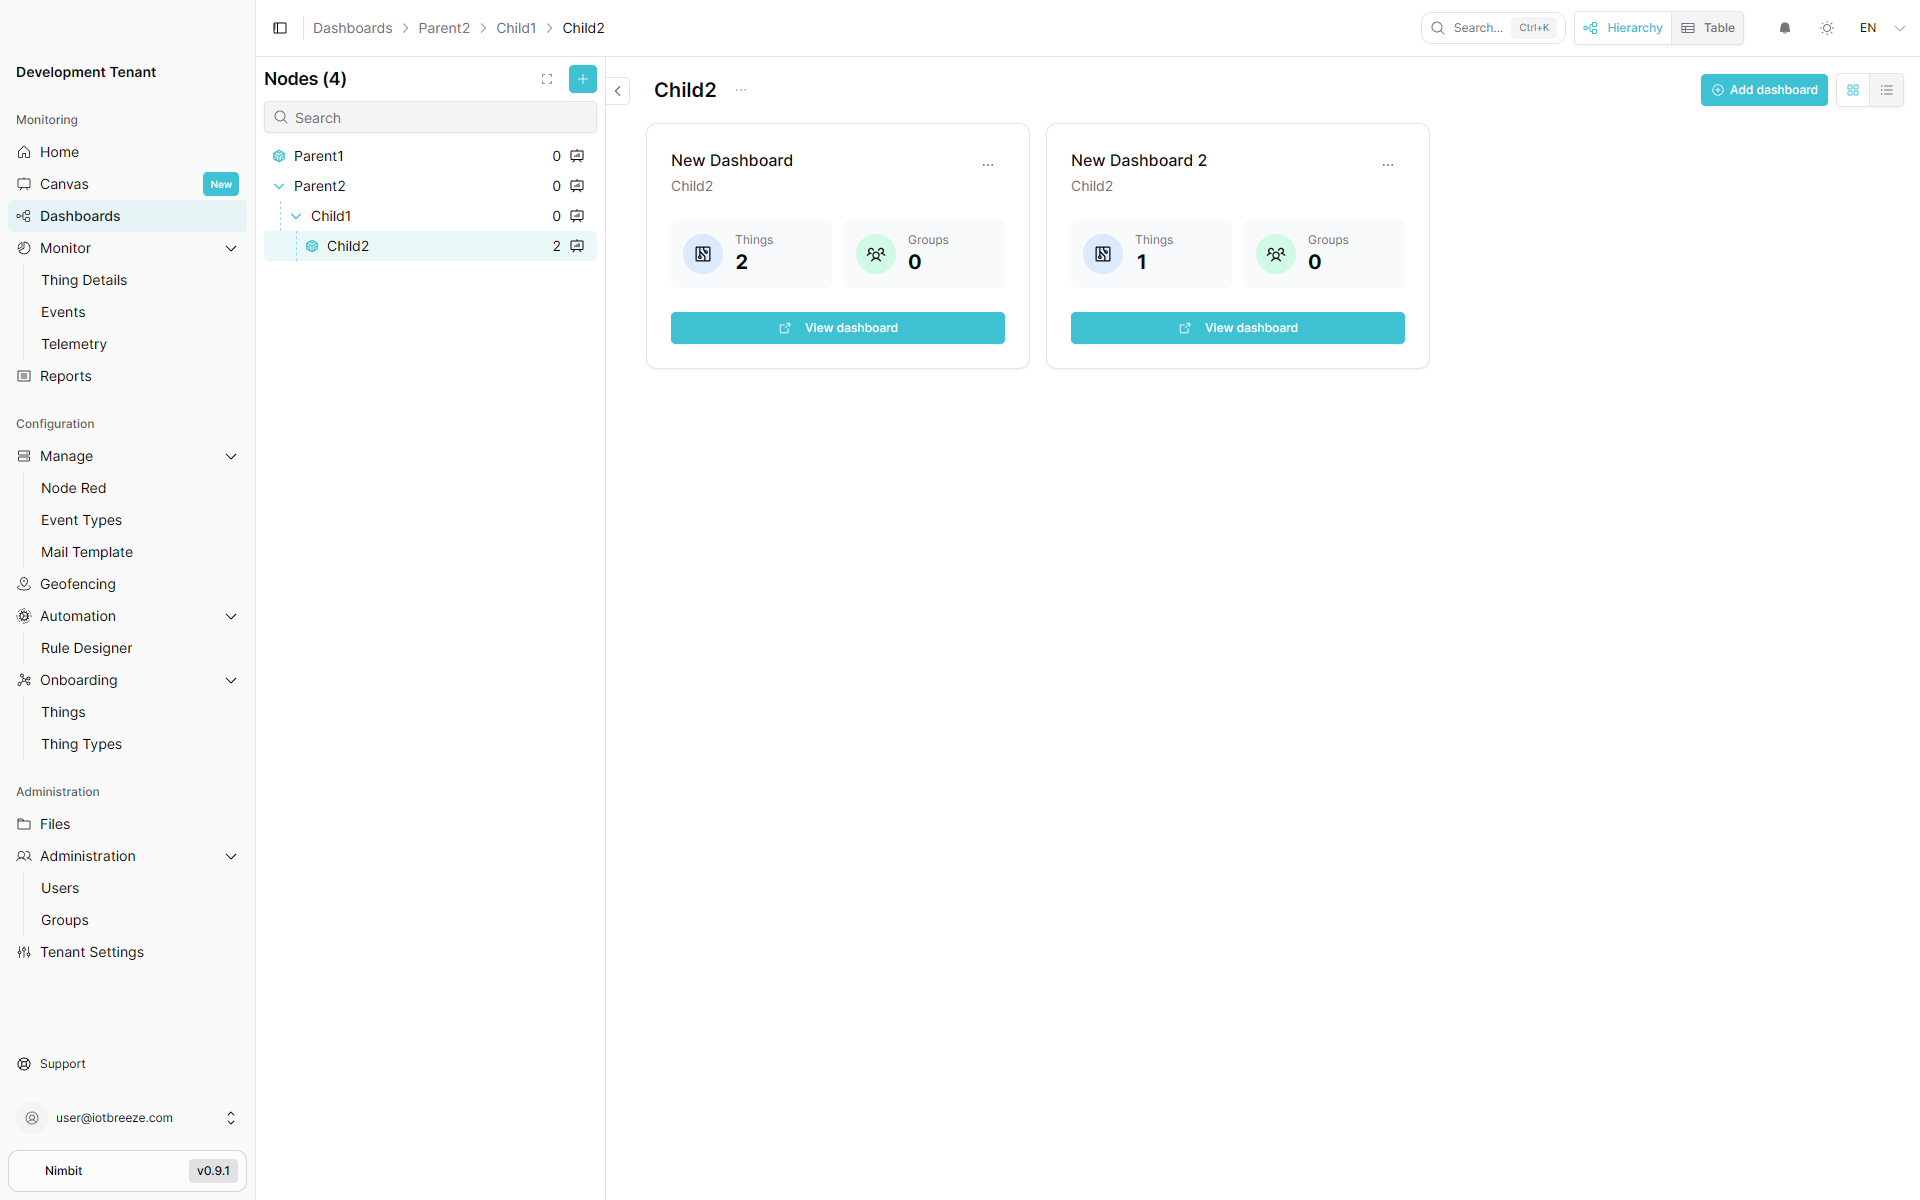
When fully populated, the tree structure clearly shows the complete organizational hierarchy with all dashboards:
List View
You can also view hierarchies and their dashboards in a traditional list format:
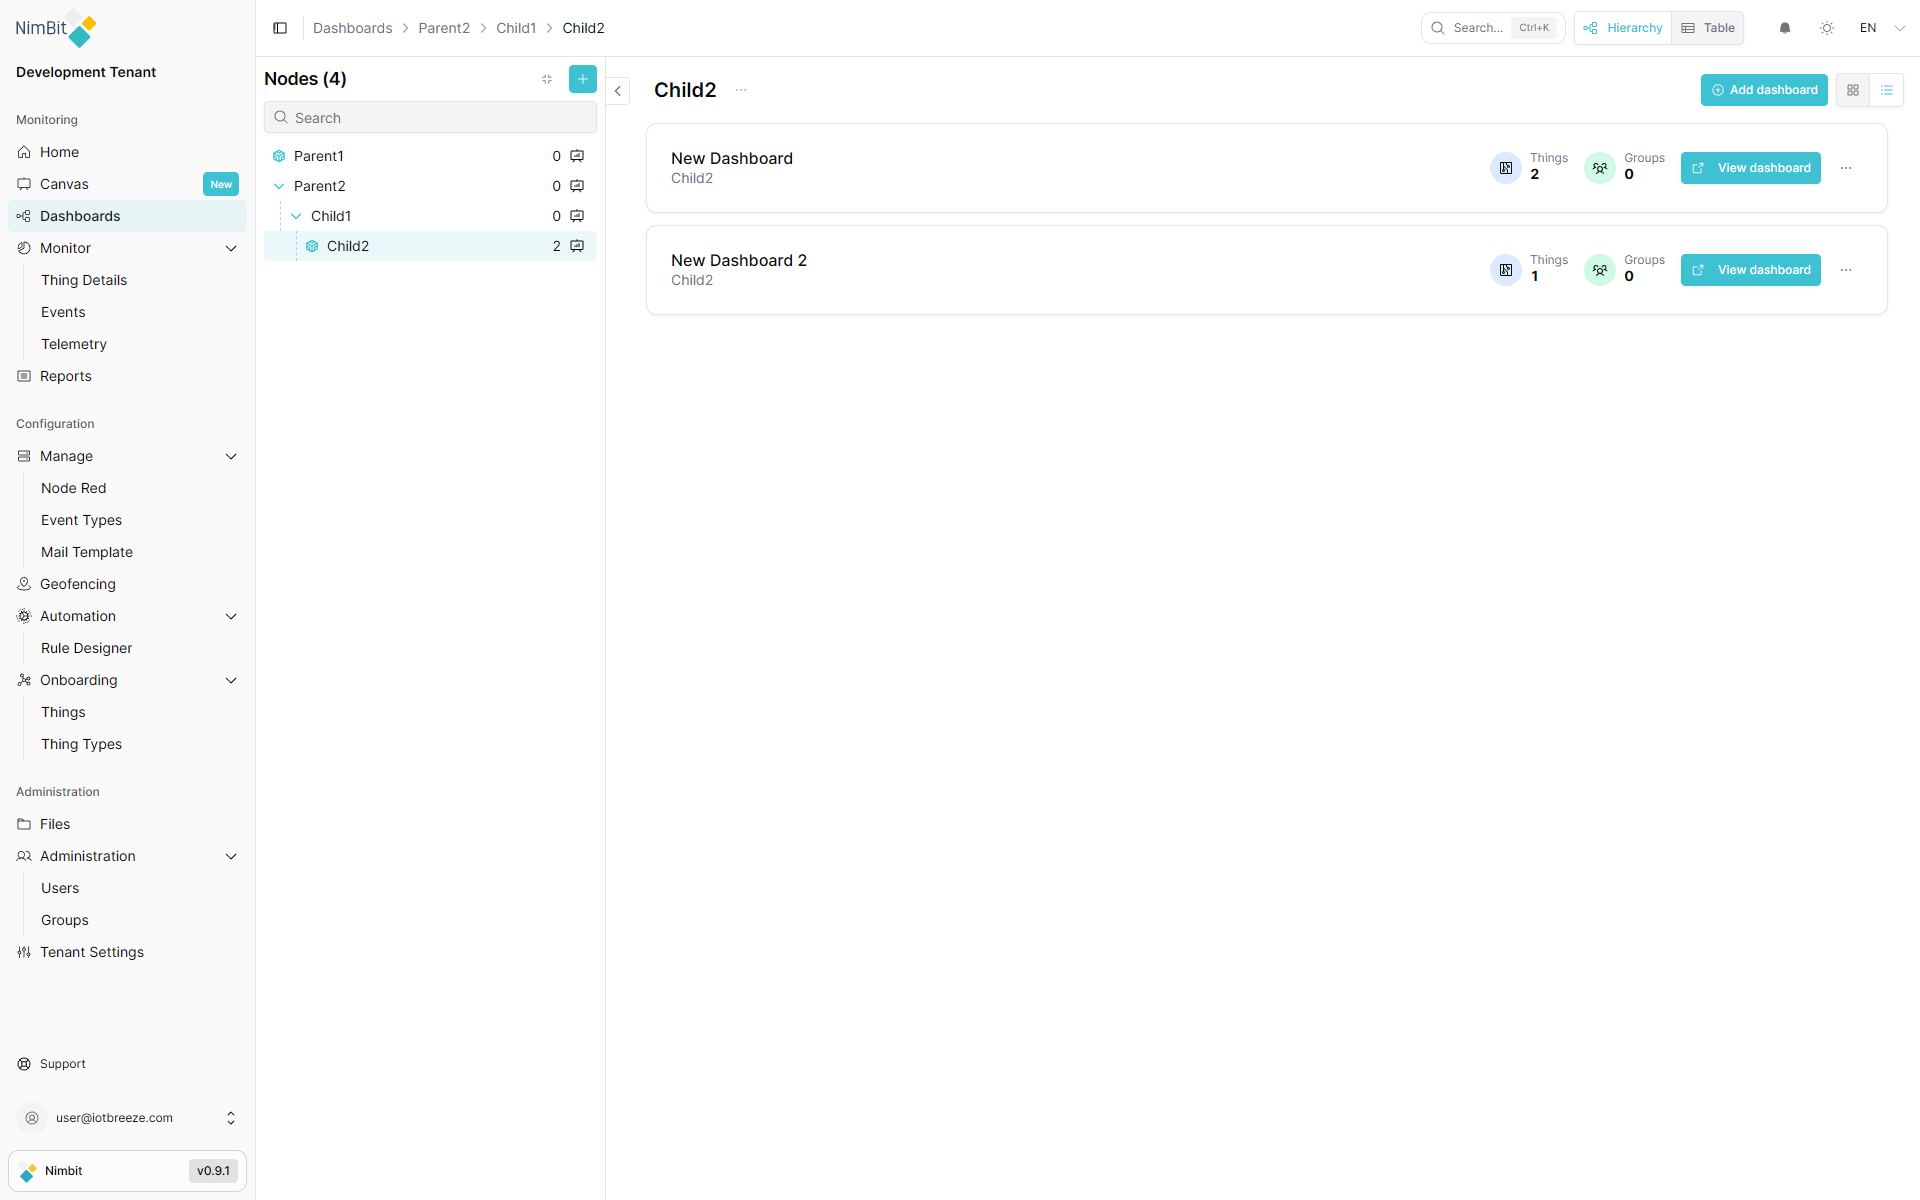
The list view displays the hierarchy relationships and their contained dashboards:
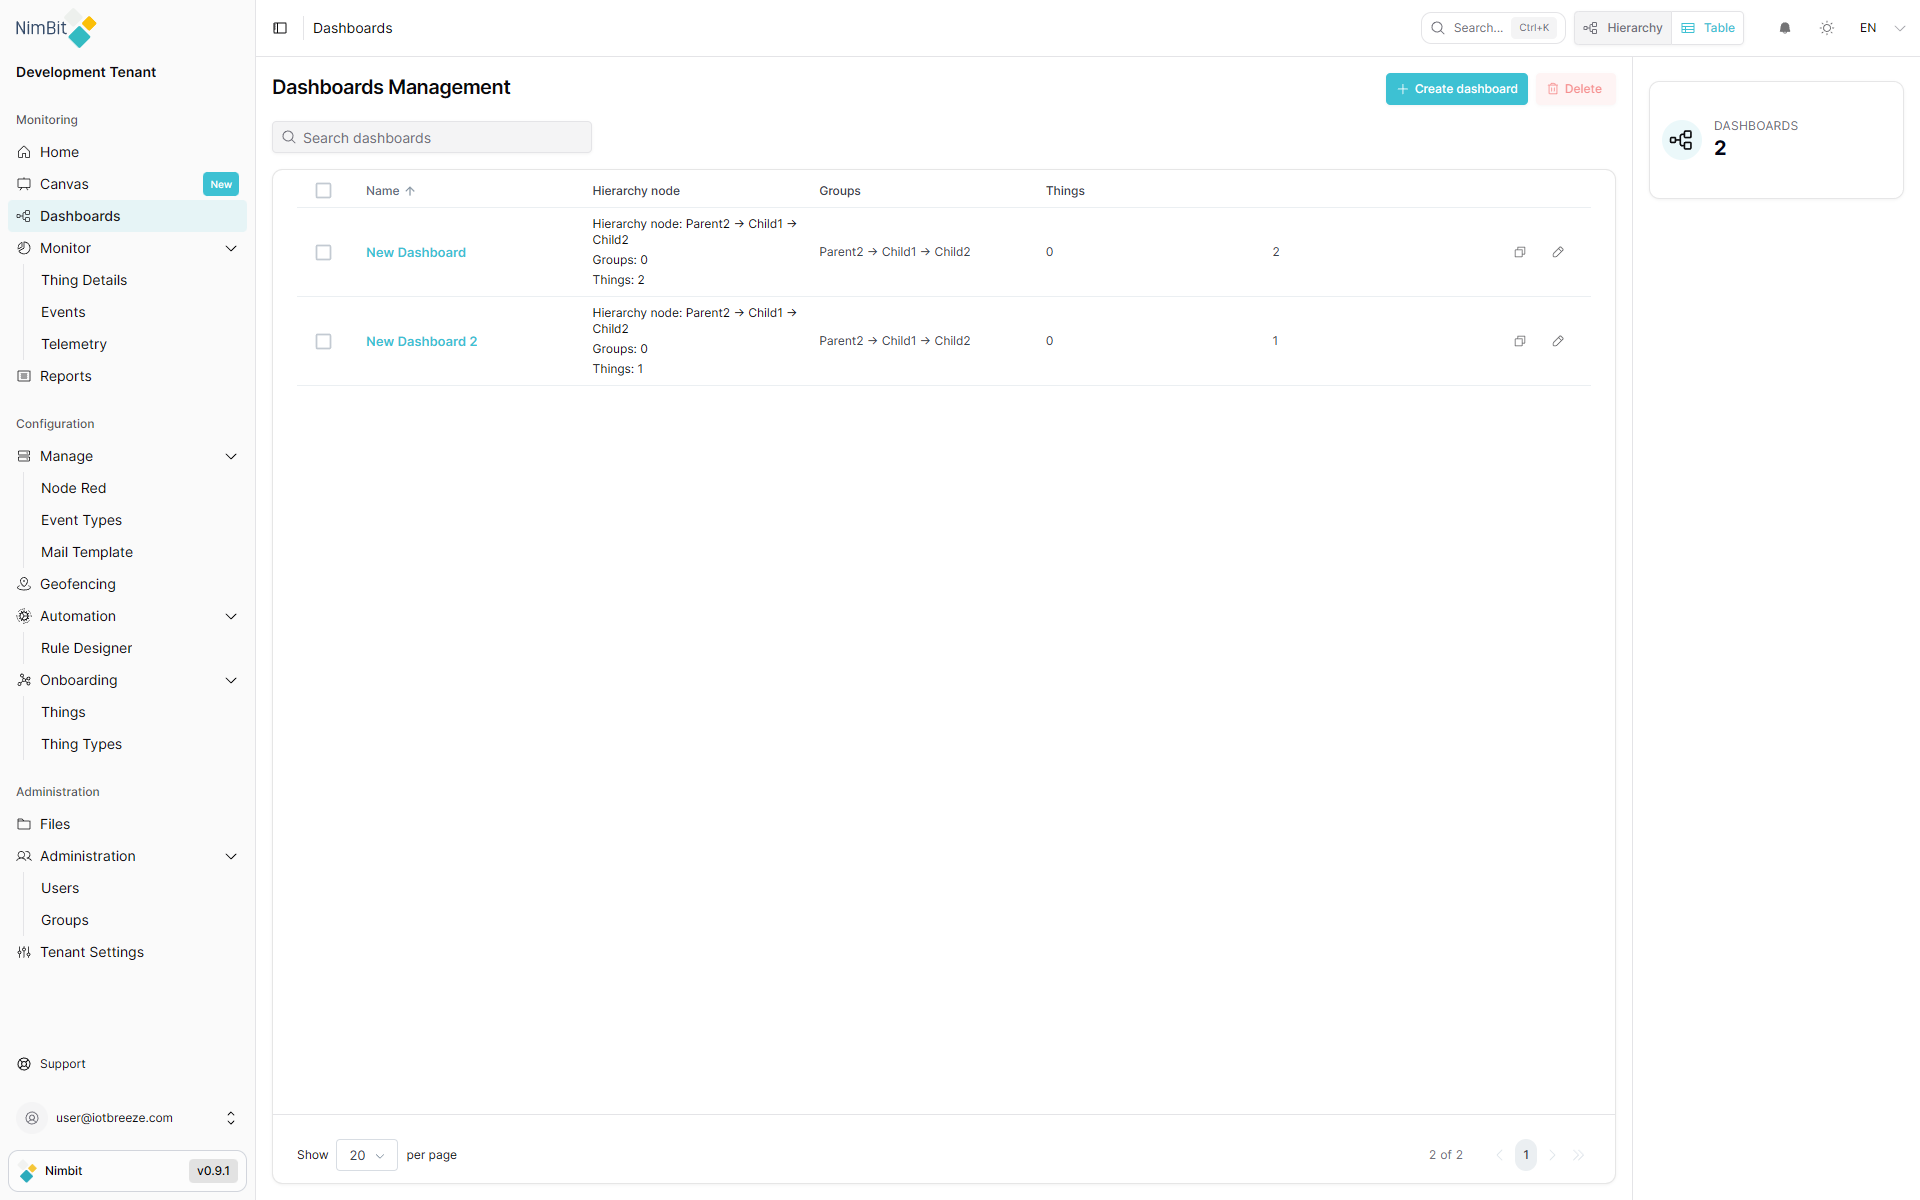
Dashboards without an assigned hierarchy are only visible in the table/list view and will not appear in the tree structure.
Creating Hierarchies
Accessing Hierarchy Creation
Navigate to the Dashboards section and click the "+" button to start creating a new hierarchy:
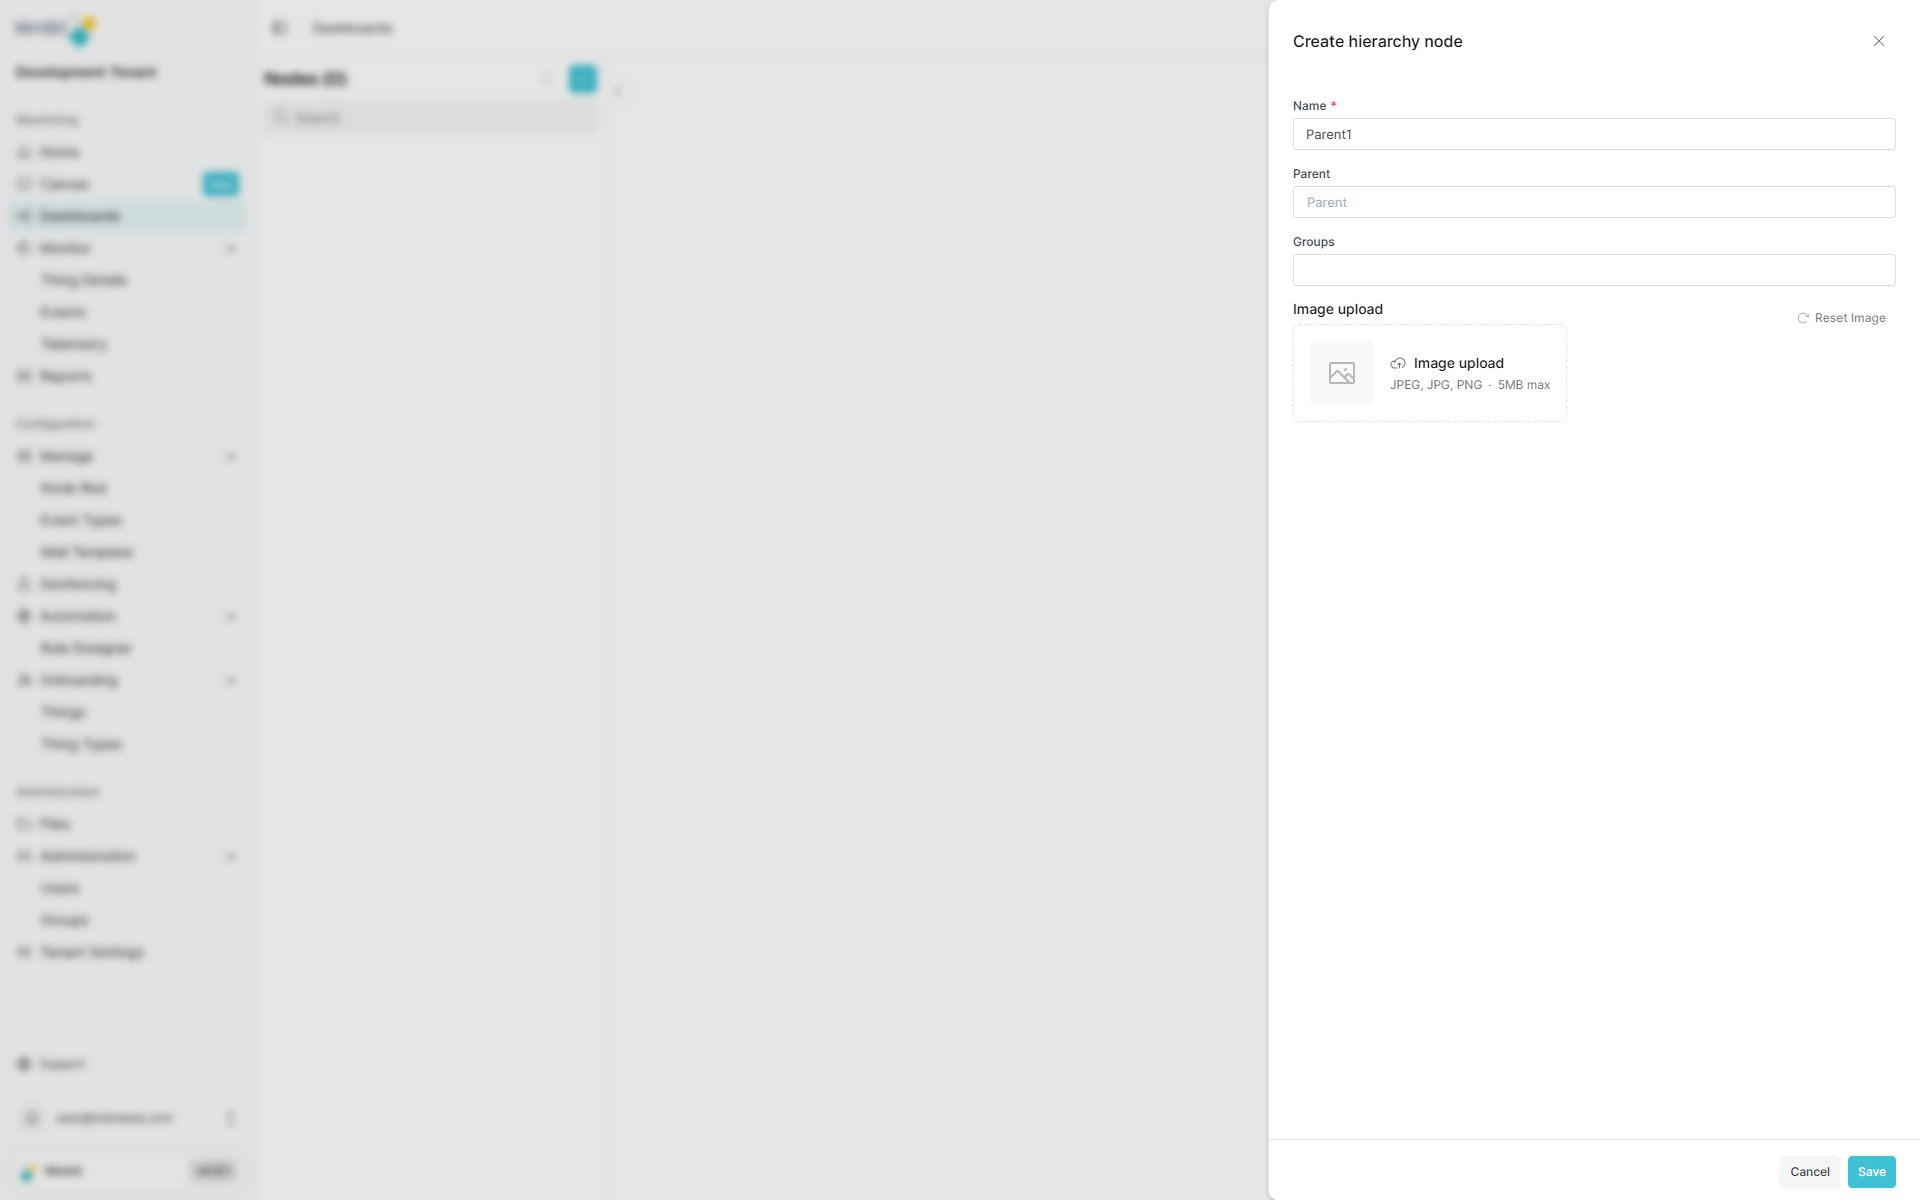
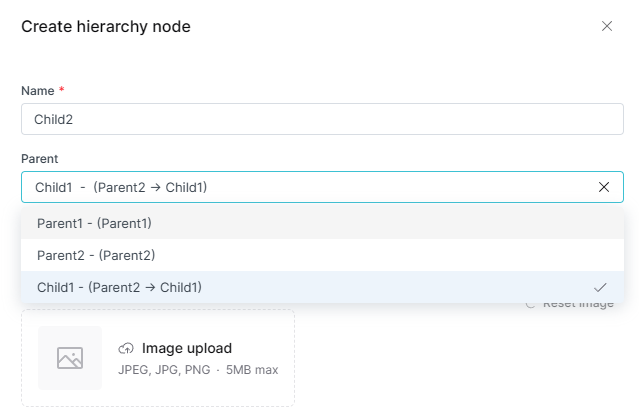
Creating a Hierarchy with Parent
Hierarchies can be created as root-level nodes or as children of existing hierarchies:
Hierarchy Properties
| Field | Required | Description |
|---|---|---|
| Name | ✅ Yes | Unique identifier for the hierarchy node. |
| Parent | ❌ No | Select a parent hierarchy to create a child node. Leave empty to create a root-level hierarchy. |
| Groups | ❌ No | Assign groups to control access and visibility for this hierarchy. |
Multiple root hierarchies are supported, allowing you to create separate organizational trees for different purposes.
Creating Dashboards
Dashboard Creation Form
You can create dashboards and optionally assign them to a hierarchy. Dashboards without a hierarchy will only appear in the table/list view:
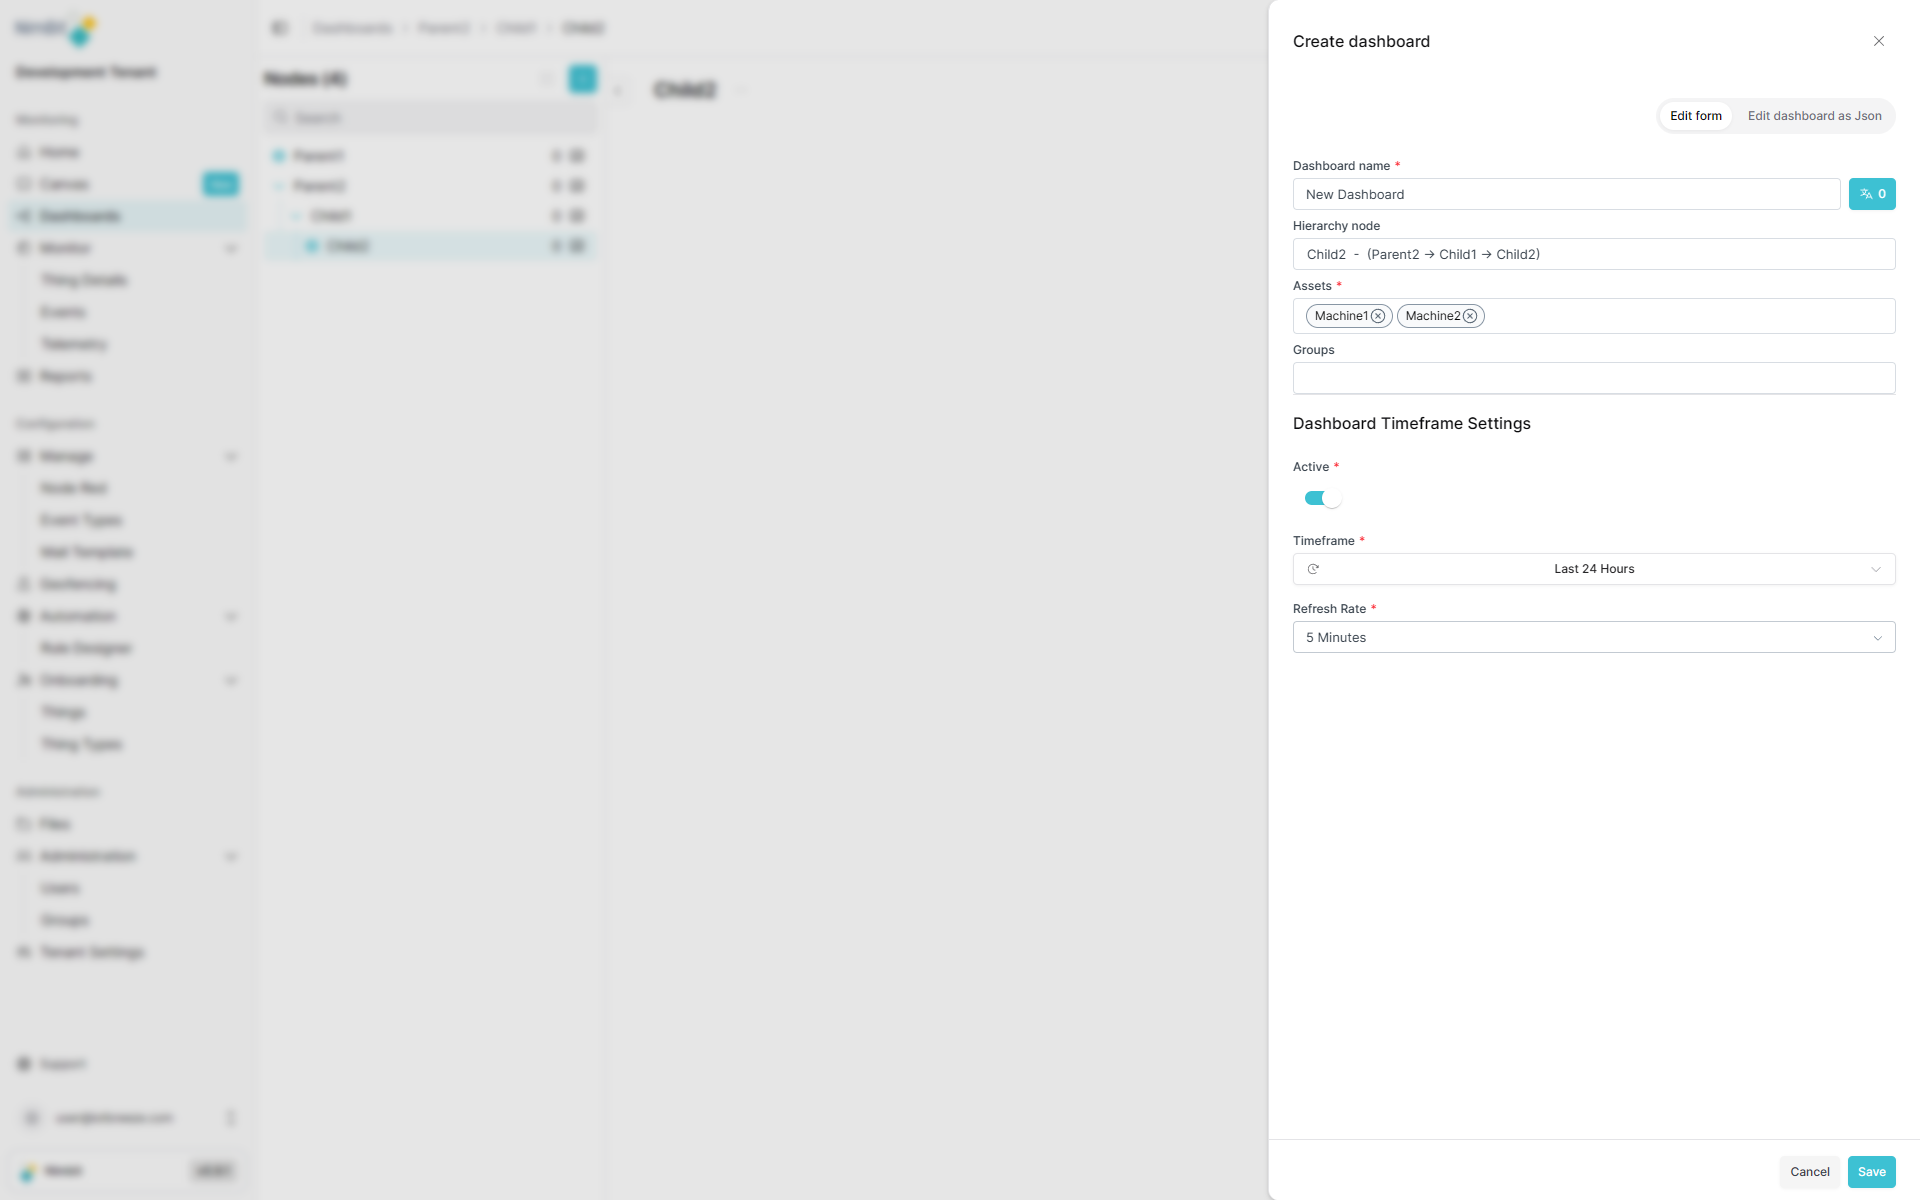
Dashboard Properties
| Field | Required | Description |
|---|---|---|
| Name | ✅ Yes | Unique identifier for the dashboard. |
| Hierarchy node | ❌ No | Select which hierarchy this dashboard belongs to. Dashboards without a hierarchy only appear in the table/list view. |
| Groups | ❌ No | Assign groups to control access and visibility for this dashboard. |
| Assets | ✅ Yes | Select one or more things to display on this dashboard. |
| Timeframe Settings | ❌ No | Enable to set default timeframe and refresh rate. |
Timeframe Configuration
When Timeframe Settings is enabled, you must configure:
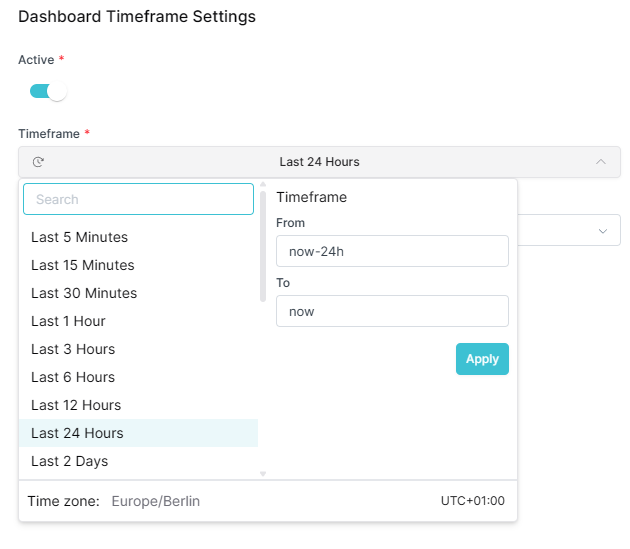
| Field | Required (if enabled) | Description |
|---|---|---|
| Timeframe | ✅ Yes | Default time range displayed when users access the dashboard. |
| Refresh Rate | ✅ Yes | How often the dashboard data automatically refreshes (in seconds). |
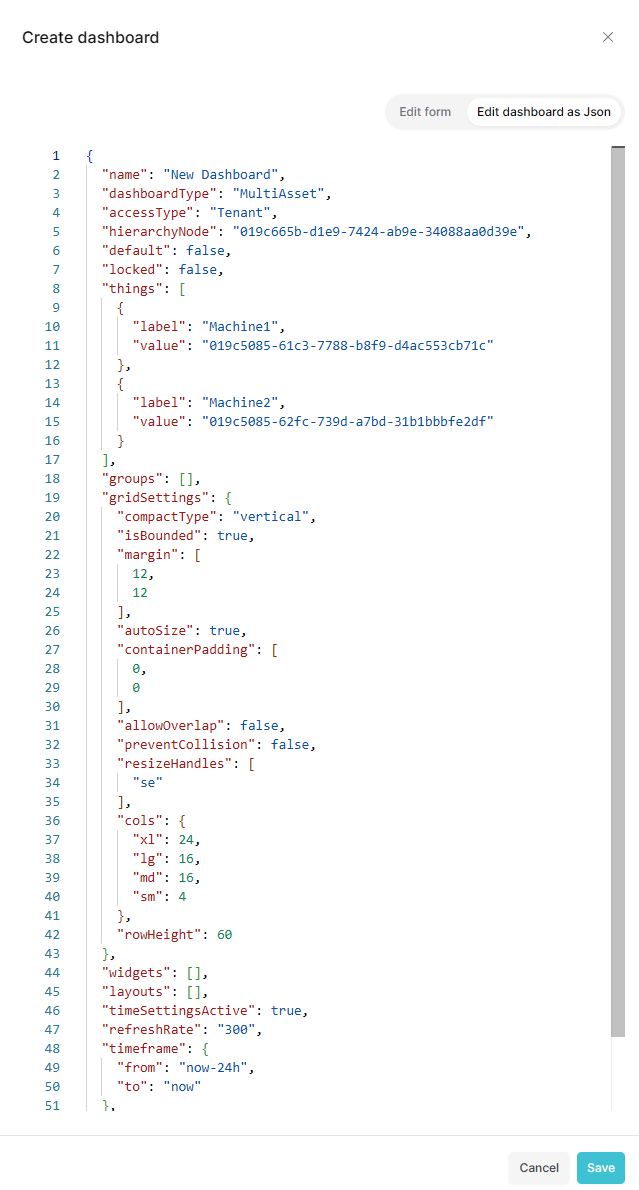
JSON-Based Creation
This method is intended for advanced users only. Incorrect JSON configuration can result in non-functional dashboards. Use the standard form creation method unless you have specific technical requirements.
For advanced users or when importing dashboard configurations, you can create dashboards using JSON:
This method is useful for:
- Importing dashboard configurations from other systems
- Programmatically creating dashboards
- Duplicating existing dashboard structures
After Creation
Once created, your new dashboard appears within its assigned hierarchy:

Best Practices
Organizing Your Hierarchies
Consider these strategies when structuring your hierarchies:
- Root Level Organization - Use root hierarchies for major divisions (facilities, departments, systems)
- Logical Grouping - Create child hierarchies for related sub-categories
- Depth Management - Avoid overly deep hierarchies (3-4 levels maximum recommended)
- Naming Conventions - Use clear, consistent naming to make navigation intuitive
- Dashboard Placement - Assign dashboards to the most appropriate hierarchy level
Example Structures
By Facility
Manufacturing (Root Hierarchy)
├── Factory A (Child Hierarchy)
│   ├── [Dashboard: Production Line 1 Overview]
│   └── [Dashboard: Production Line 2 Overview]
└── Factory B (Child Hierarchy)
    ├── [Dashboard: Assembly Monitoring]
    └── [Dashboard: Quality Control]
By System
Enterprise Monitoring (Root Hierarchy)
├── IoT Devices (Child Hierarchy)
│   ├── [Dashboard: Sensor Status]
│   └── [Dashboard: Controller Management]
├── Infrastructure (Child Hierarchy)
│   ├── [Dashboard: Network Performance]
│   └── [Dashboard: Server Health]
└── Business Analytics (Child Hierarchy)
    └── [Dashboard: KPI Overview]
Multiple Root Hierarchies
Production (Root Hierarchy)
├── Line 1 (Child Hierarchy)
└── Line 2 (Child Hierarchy)

Quality (Root Hierarchy)
├── Testing (Child Hierarchy)
└── Compliance (Child Hierarchy)

Maintenance (Root Hierarchy)
└── Schedules (Child Hierarchy)
Navigation Benefits
Using separate hierarchy entities to organize dashboards provides multiple benefits:
- Flexible Organization - Create multiple root hierarchies for different organizational needs
- Contextual Browsing - Navigate from high-level hierarchies to specific dashboards naturally
- Quick Access - Find dashboards quickly through the tree structure
- Visual Organization - See at a glance how hierarchies and dashboards relate
- Scalability - Manage large numbers of dashboards without losing structure
- Separation of Concerns - Keep organizational structure independent from dashboard content