Thing Details
The Thing Details page provides comprehensive monitoring and management capabilities for individual IoT devices (things) in your system. This interface serves as a central hub for viewing thing status, accessing associated dashboards and managing thing-specific configurations.
Overview
The Thing Details feature enables you to:
- View all things in a filterable, sortable list with real-time status information
- Monitor device connectivity and operational status at a glance
- Access thing-specific dashboards with custom widgets and data visualizations
- Switch between views (List, Map, Split) to match your monitoring preferences
- Navigate quickly to detailed information for any specific thing
This page is essential for day-to-day operations, troubleshooting connectivity issues and maintaining an overview of your entire device fleet.
Accessing Thing Details
To access the Thing Details page:
- Navigate to Monitor in the main sidebar
- Select Thing Details from the Monitor submenu
- Alternatively, use the direct URL:
/monitor/thing-details
Thing List View
The default view presents all things in a comprehensive table format with multiple viewing options.
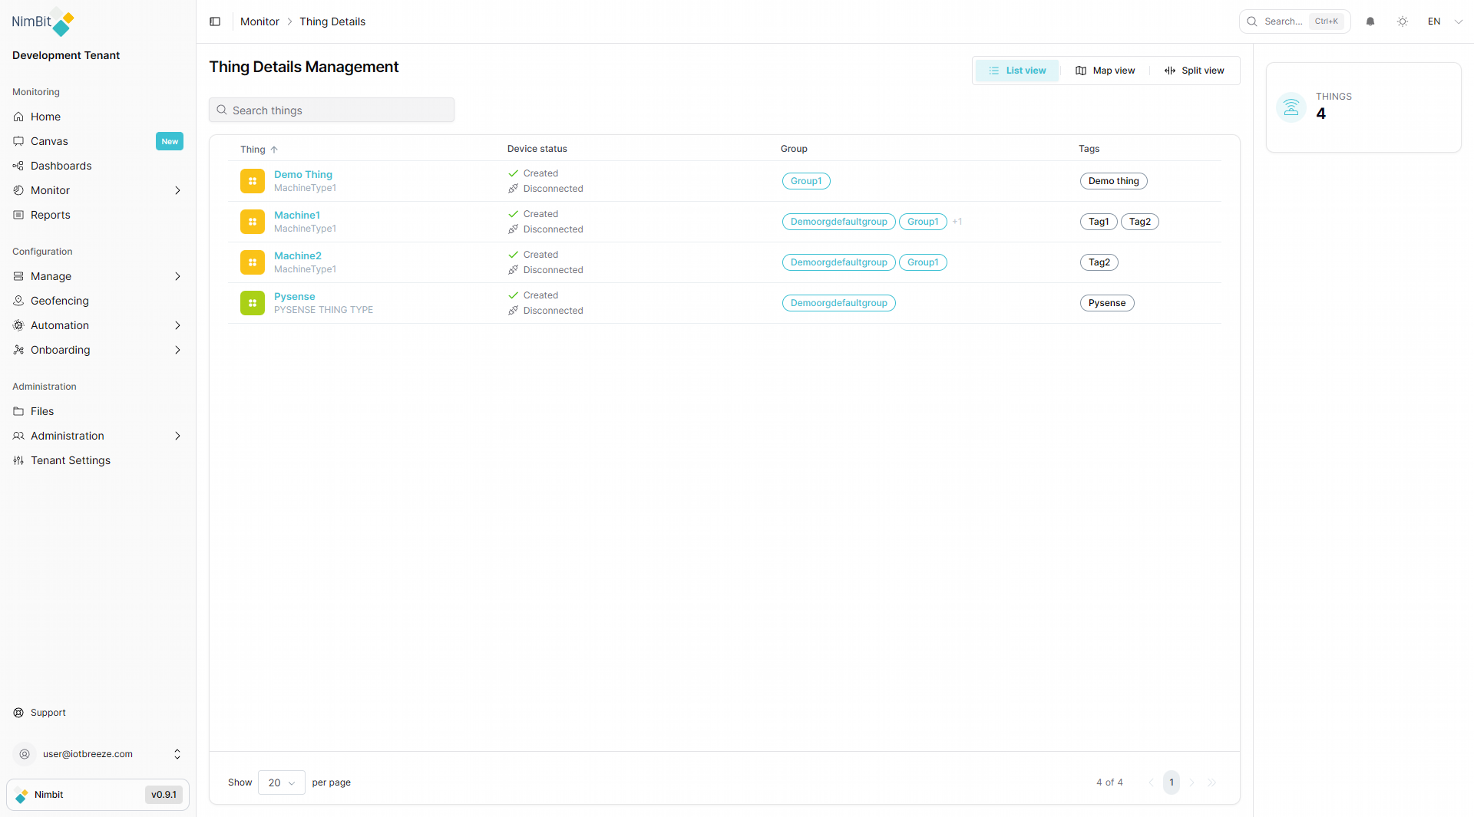
View Options
Three view modes are available via the toolbar buttons:
- List view - Table format with detailed columns (default)
- Map view - Geographic visualization of thing locations
- Split view - Combined list and map display
Search and Filter
Use the Search things box to quickly filter the list by:
- Thing name
- Device type
- Group membership
- Tag associations
The search updates results in real-time as you type.
Table Columns
The Things table displays the following information:
| Column | Description |
|---|---|
| Thing | Thing name with icon and device type |
| Device status | Current operational status (Created, Active, etc.) and connection status (Connected/Disconnected) |
| Group | Associated groups (can display multiple groups with "+N" indicator for additional groups) |
| Tags | Custom tags assigned to the thing |
Click the Thing column header (with arrow icon) to sort the table by that column. Click again to reverse the sort order.
Status Indicators
Each thing displays two key status indicators:
Operational Status
- Created - Thing has been successfully created
- Additional states may Creating in provider, Failed, etc.
Connection Status
- Disconnected - Thing is not currently connected to the platform
- Connected - Thing is actively communicating with the platform
Pagination
The table footer provides pagination controls:
- Show [N] per page - Dropdown to select items per page (default: 20)
- Page navigation - First page, previous, current page number, next, last page buttons
- Item counter - Displays "X of Y" total things
The things counter in the sidebar shows the total number of things (e.g., "THINGS: 4").
Viewing Individual Thing Details
Click on any thing name in the list to access its detailed view.
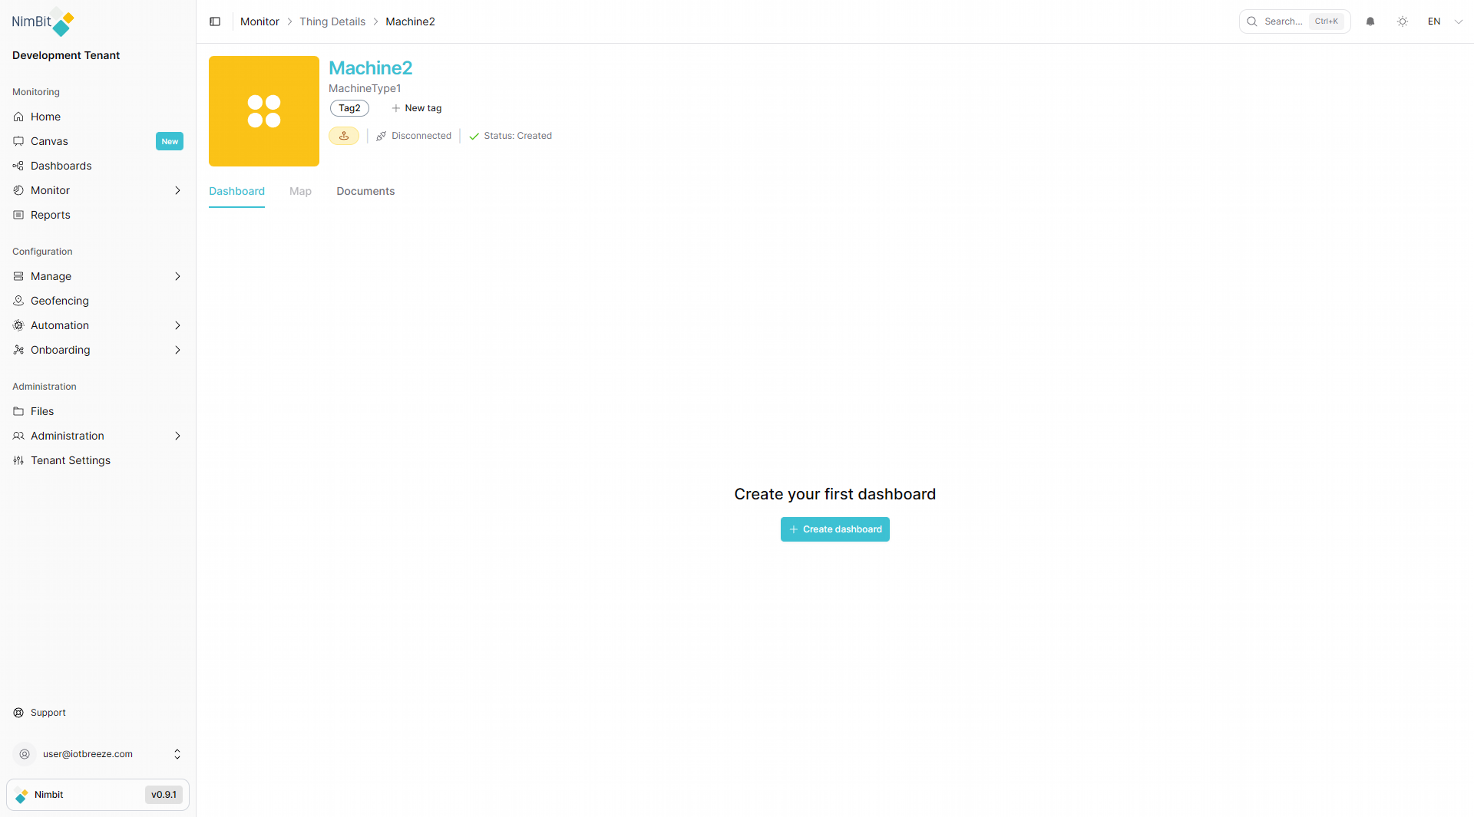
Thing Header
The detail view displays:
- Thing image - Displays the image uploaded for this thing or type. When there is no image shows a colored default icon
- Thing name - Large heading (e.g., "Machine2")
- Device type - Subheading showing the thing type (e.g., "MachineType1")
- Tags - Existing tags with "New tag" button for adding more
- Geo - An icon either yellow or green. Indicates if a geolocation has been recorded for this device. Can be clicked to update the geolocation of the thing
- Status badges - Visual indicators for connection and operational status
Navigation Tabs
Three tabs organize thing information:
- Dashboard - Custom dashboards with widgets and data visualizations
- Map - Geographic location and tracking (may be disabled if no location is recorded)
- Documents - Associated files and documentation
Dashboard Management
The Dashboard tab is the primary interface for monitoring thing-specific data through customizable widgets.
Creating Your First Dashboard
When no dashboard exists for a thing, you'll see an empty state:
- Message: "Create your first dashboard"
- Create dashboard button
Click the "Create dashboard" button to open the Dashboard Settings dialog.
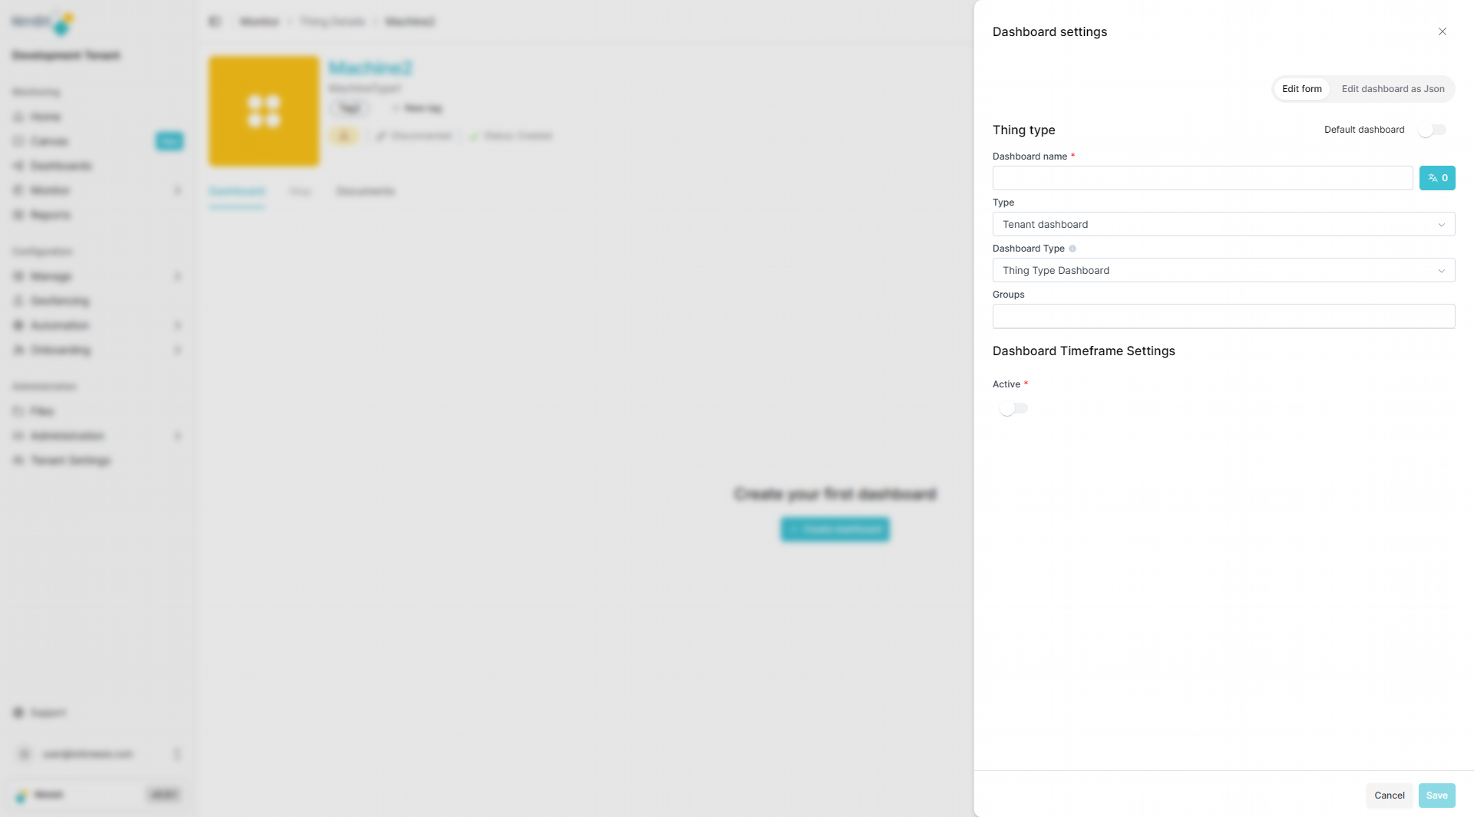
Dashboard Settings
The Dashboard Settings dialog includes two tabs:
Edit form (default)
When creating a Thing Dashboard, you must specify:
| Field | Required | Description |
|---|---|---|
| Dashboard name | ✅ Yes | Enter a descriptive name for the dashboard. |
| Default dashboard | ❌ No | Checkbox to set as the default dashboard for this thing type. |
| Type | ✅ Yes | Select between Tenant dashboard or other scope options. |
| Dashboard Type | ✅ Yes | Choose between Thing Dashboard (only for this device) or Thing Type Dashboard (for all devices of the same type). |
| Groups | ❌ No | Select which groups can access this dashboard. |
| Dashboard Timeframe Settings | ❌ No | Configure time-based data display options. |
Edit dashboard as Json
- Advanced JSON editor for direct dashboard configuration manipulation
A Thing Dashboard is specific to one device, while a Thing Type Dashboard will be available for all devices of the same type. Use Thing Type Dashboards to maintain consistency across similar devices.
After configuring settings, click Save to create the dashboard.
Working with Dashboards
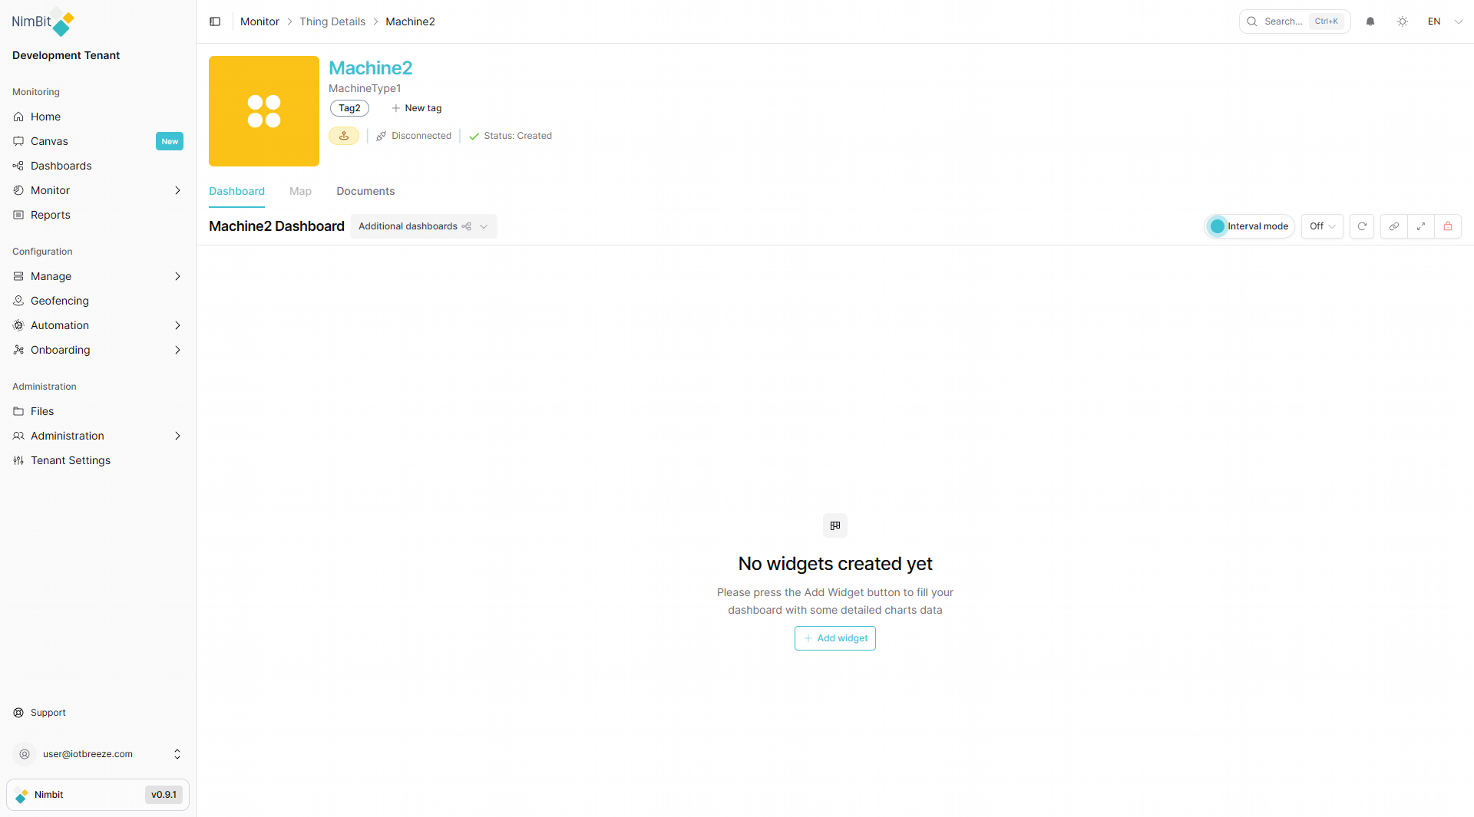
Once created, the dashboard displays with:
Dashboard Toolbar
- Dashboard name - Currently selected dashboard title
- Additional dashboards - Dropdown to switch between multiple dashboards (if configured)
- Interval mode - Toggle for automatic data refresh
- Off/Time selector - Set refresh interval
- Refresh button - Manual data refresh
- Link button - Copy dashboard URL
- Fullscreen - Expand dashboard to full screen
- Delete - Remove the dashboard
Empty Dashboard State
When first created, dashboards display:
- Message: "No widgets created yet"
- Instructions: "Please press the Add Widget button to fill your dashboard with some detailed charts data"
- Add widget button - Opens widget configuration dialog
Adding Widgets
Click the Add widget button to:
- Select a widget type (charts, gauges, maps, etc.)
- Configure data sources and display options
- Position and size the widget on the dashboard
- Save to add the widget to your dashboard
For a comprehensive overview of available widget types and their configuration options, see the Widgets documentation.
Widgets can be:
- Moved by dragging
- Resized by dragging edges
- Edited by clicking widget settings
- Deleted by clicking the delete icon
Multiple Dashboards
Things can have multiple dashboards for different monitoring needs:
- Use the Additional dashboards dropdown to switch between them
- Create specialized dashboards for different user roles or monitoring scenarios
- Set one as the default dashboard for quick access
Map View
The Map tab may be disabled if location services are not configured for the thing. Enable location tracking in thing settings to use this feature.
When enabled, the Map view displays:
- Geographic location of the thing
- Movement history and tracking
- Geofence boundaries (if configured)
- Real-time location updates
Documents Tab
Access thing-specific documentation through the Documents tab:
- Uploaded manuals and specification sheets
- Configuration files
- Maintenance records
- Photos and diagrams
Use this tab to keep all thing-related documentation centralized and easily accessible.
Best Practices
Dashboard Organization
- Use Thing Type Dashboards for consistency across similar devices
- Create role-specific dashboards for different user needs (operations, maintenance, management)
- Keep dashboards focused - Don't overcrowd with too many widgets
- Set appropriate refresh intervals - Balance real-time data needs with system performance
Thing Management
- Apply consistent tagging - Use a standardized tagging scheme across your organization
- Monitor regularly - Check the thing list daily for disconnection issues
- Document thoroughly - Upload relevant documentation to the Documents tab
Performance Tips
- Use search and filtering - Rather than scrolling through long lists
- Limit per-page items - For large deployments, smaller page sizes load faster
- Optimize dashboards - Remove unused widgets and set reasonable refresh intervals
Related Documentation
- Telemetry - View detailed telemetry data streaming from things
- Dashboards - Learn more about dashboard creation and widget configuration
- Groups - Manage thing groups and permissions
- Thing Types - Configure and manage thing types