Telemetry
Overview
Telemetry in IoTBreeze allows you to visualize historical and real-time data across multiple Things. Instead of focusing on a single device, telemetry views aggregate measures from various Things - giving you a powerful and flexible dashboard for data analysis.
You can create reusable views tailored to specific ThingTypes, Things, Measures and Aggregations and visualize them using different chart types.
Navigating to Telemetry
From the sidebar, go to Monitor → Telemetry.
If no telemetry views exist yet, you’ll see an empty state with a list:
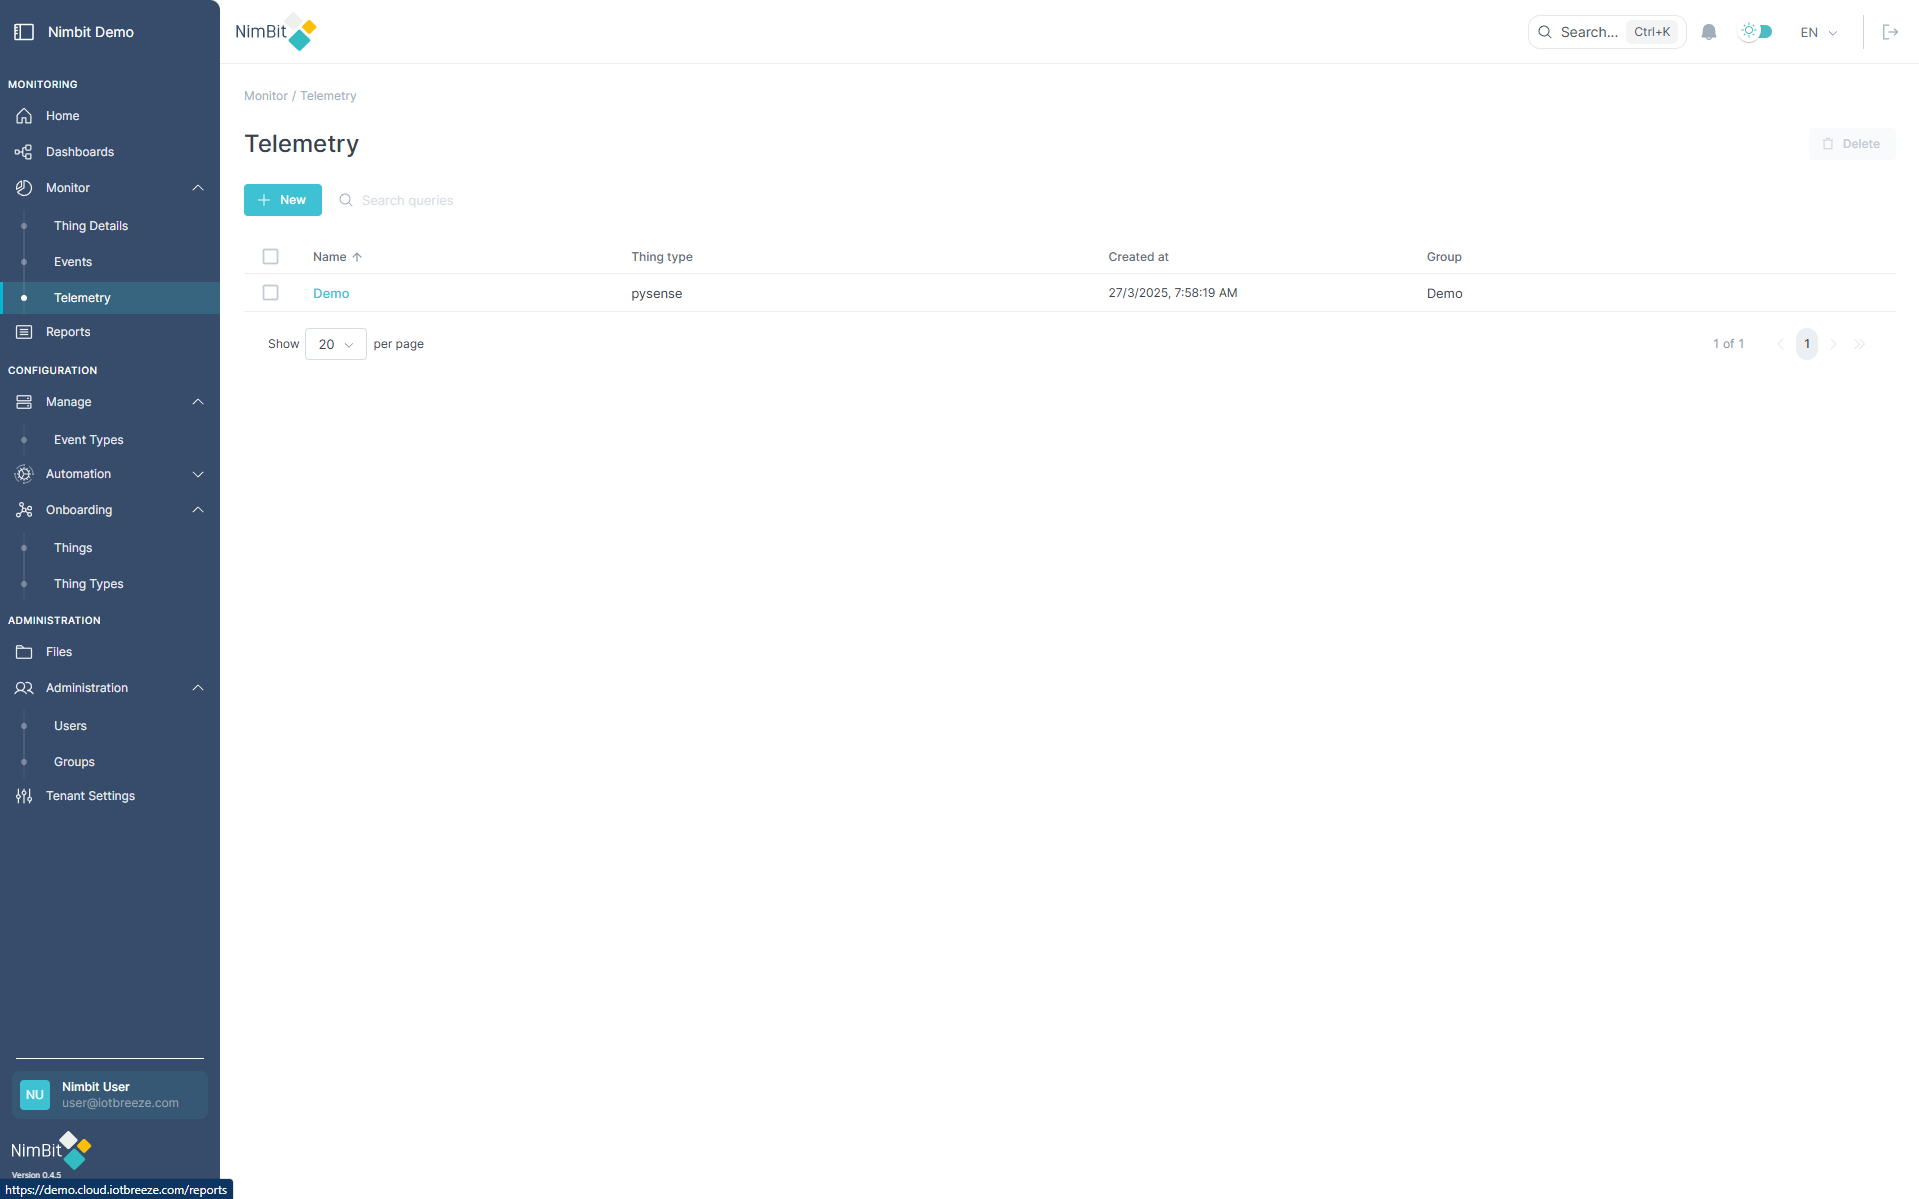
Click on a view’s name to open it.
Creating a Telemetry View
To create a new telemetry view:
- Click the "Create" button in the top-left corner.
- The telemetry configuration window opens.
- At the top of the window, select a Timeframe and a Bucket Size to define how data should be grouped.
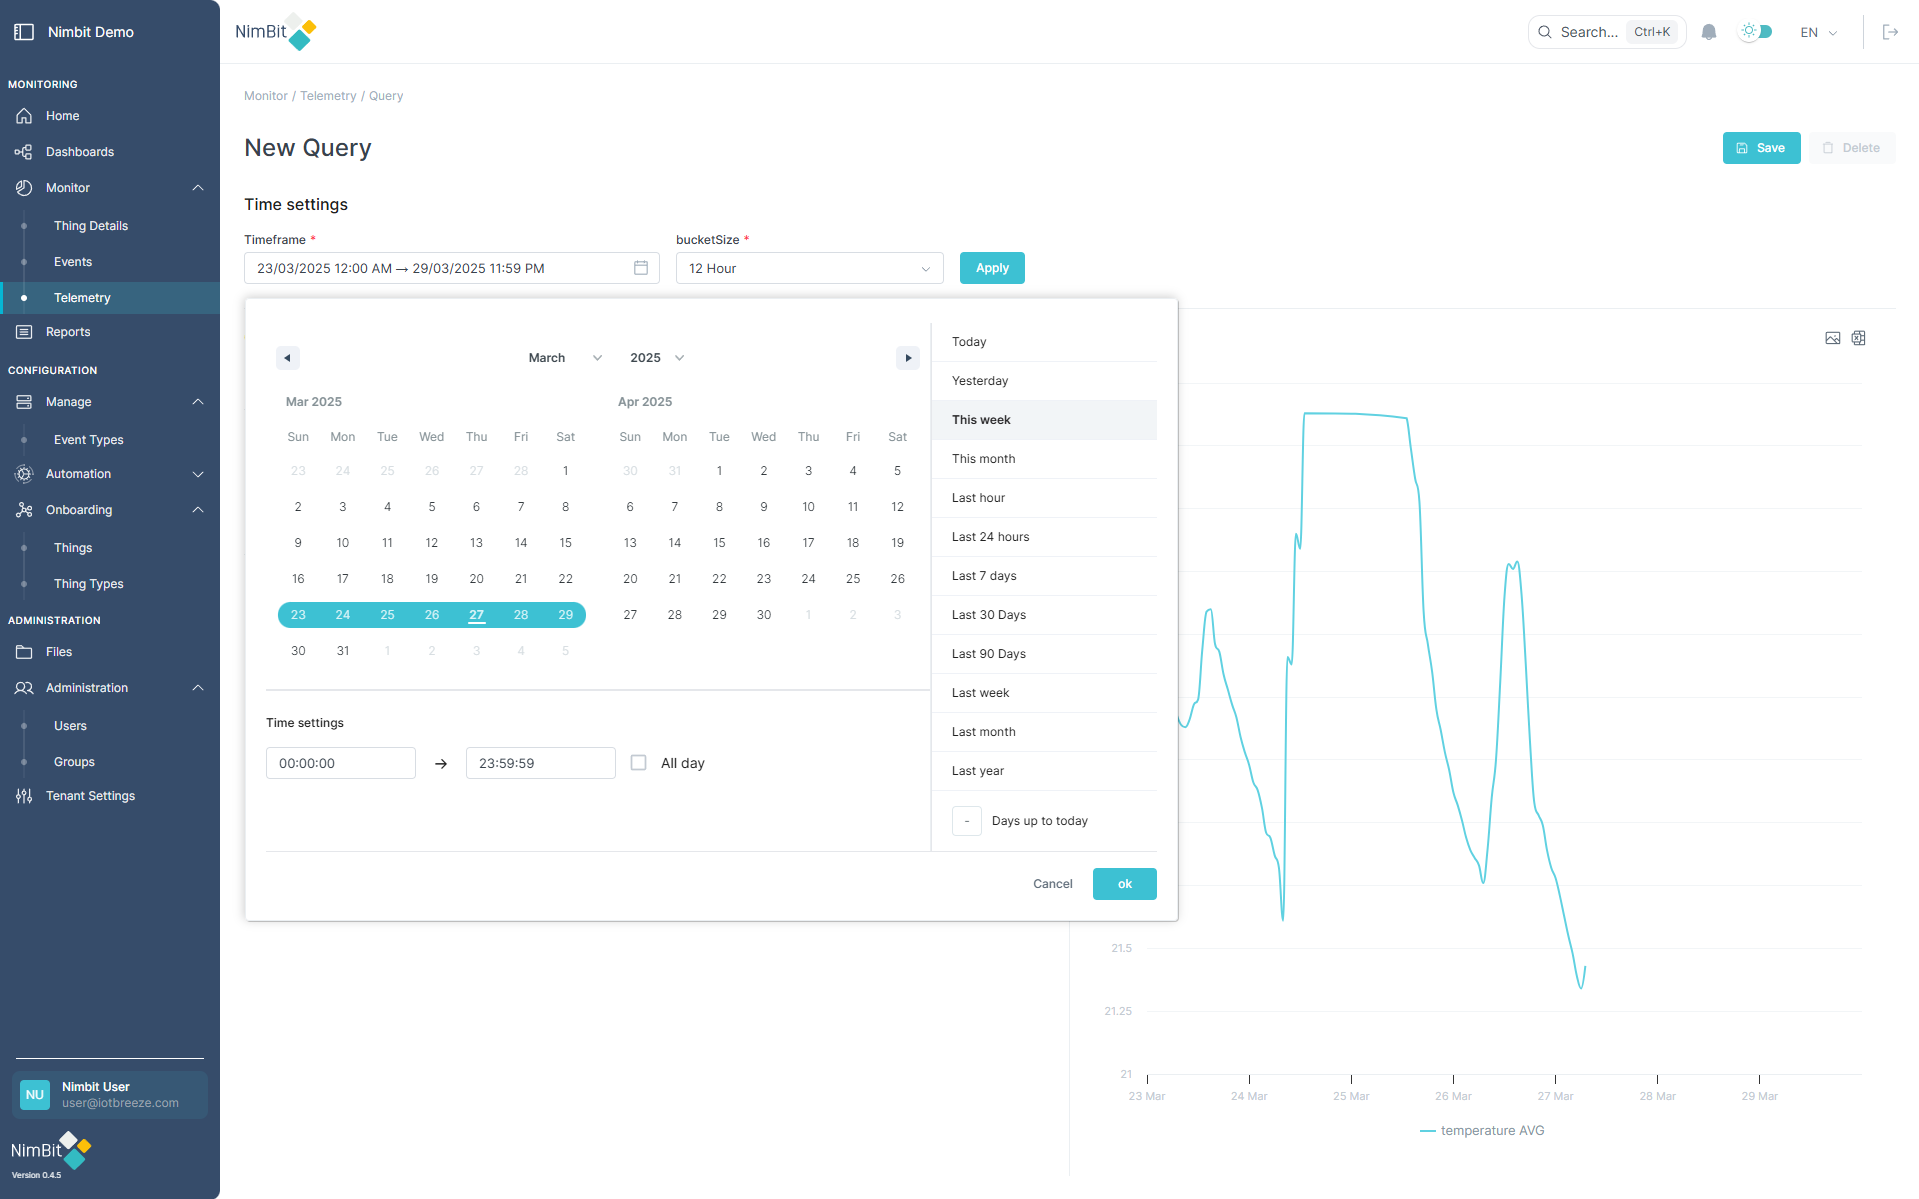
Timeframe Selector
You can choose a timeframe using either:
- Predefined presets: Today, Yesterday, Last 7 Days, Last 30 Days, Last Month, etc.
- Manual selection: Pick a start and end date and time from the calendar.
Bucket Selector
For large timeframes, telemetry uses buckets to summarize data using your selected aggregation (e.g. average, min, max).
Click on a bucket to drill down into more detailed intervals:
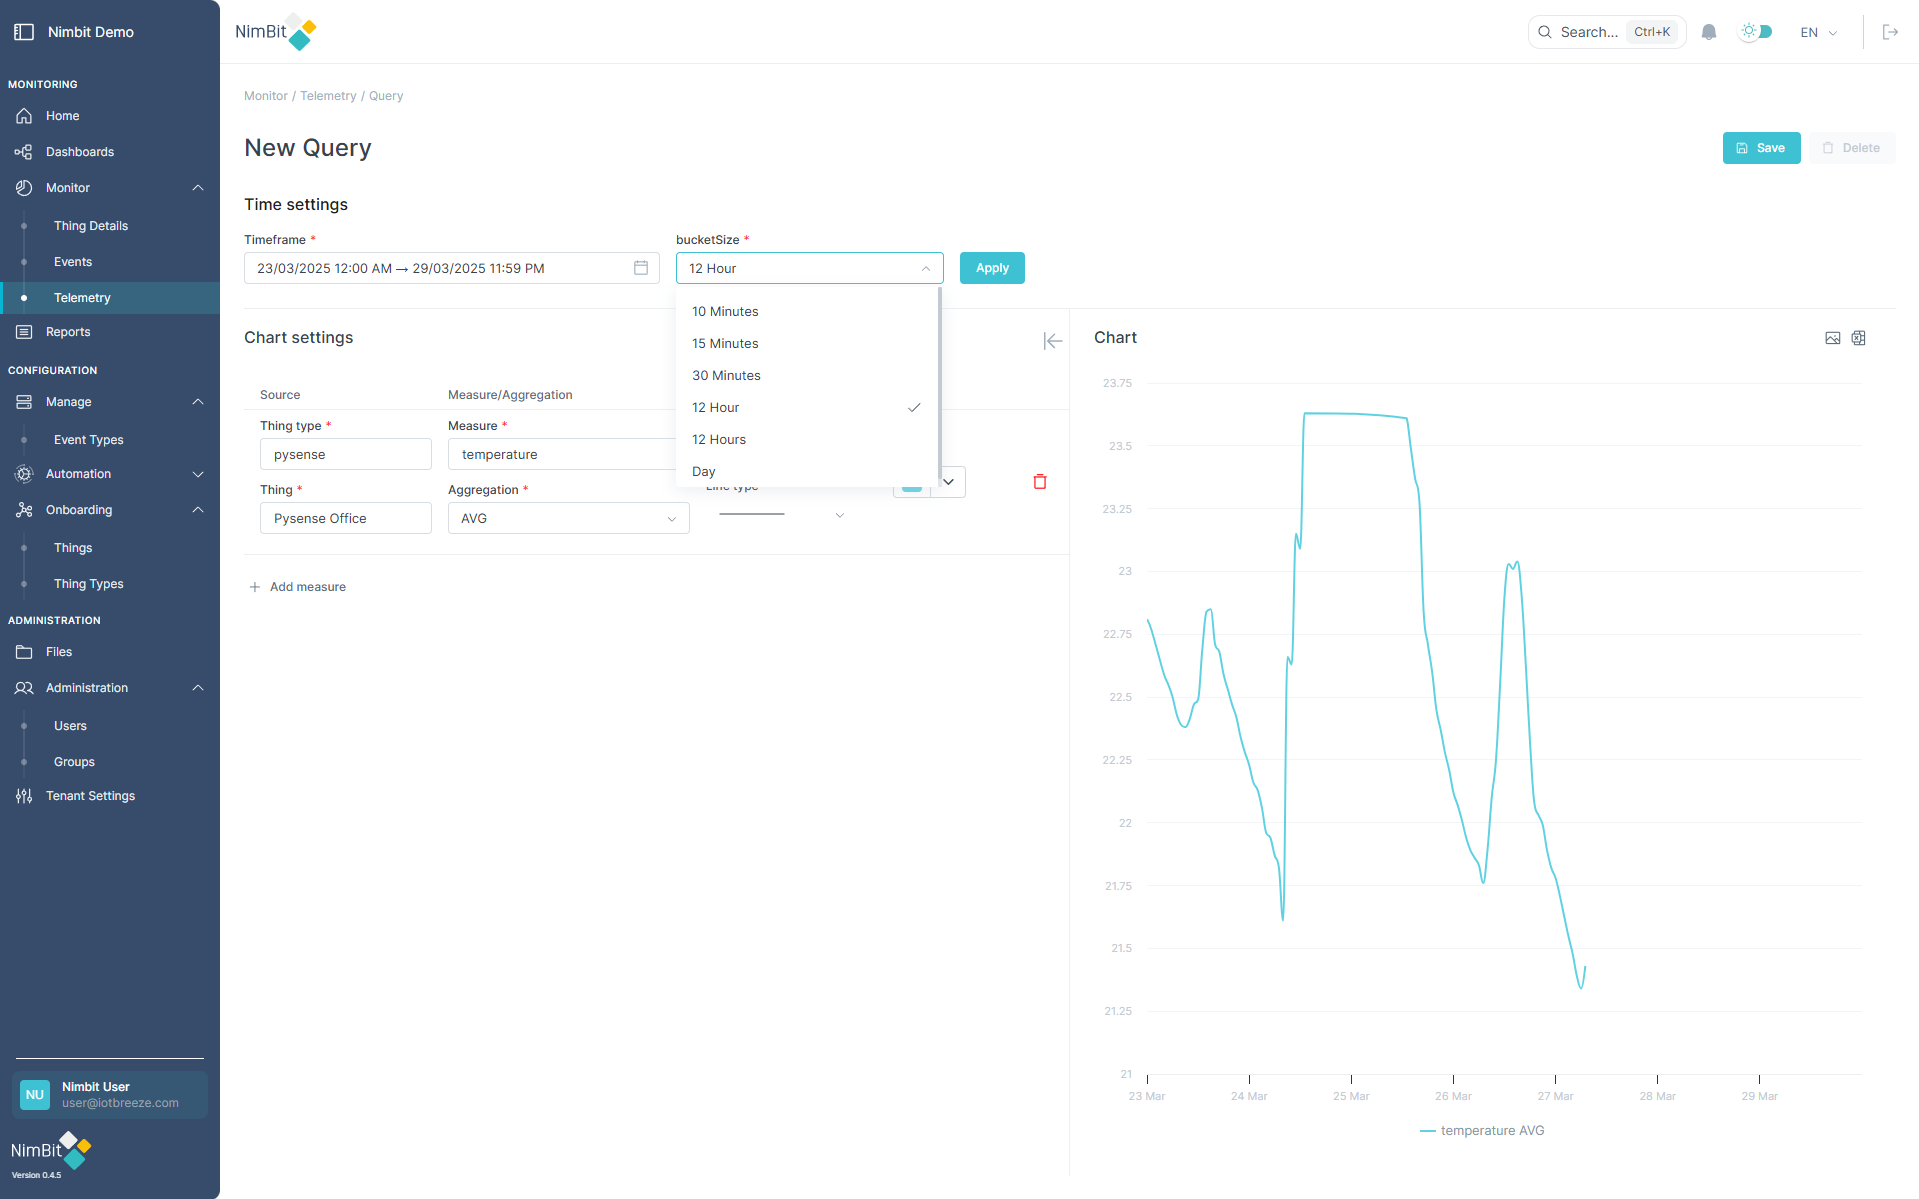
📦 Bucketing improves performance and reduces clutter during long-range data analysis.
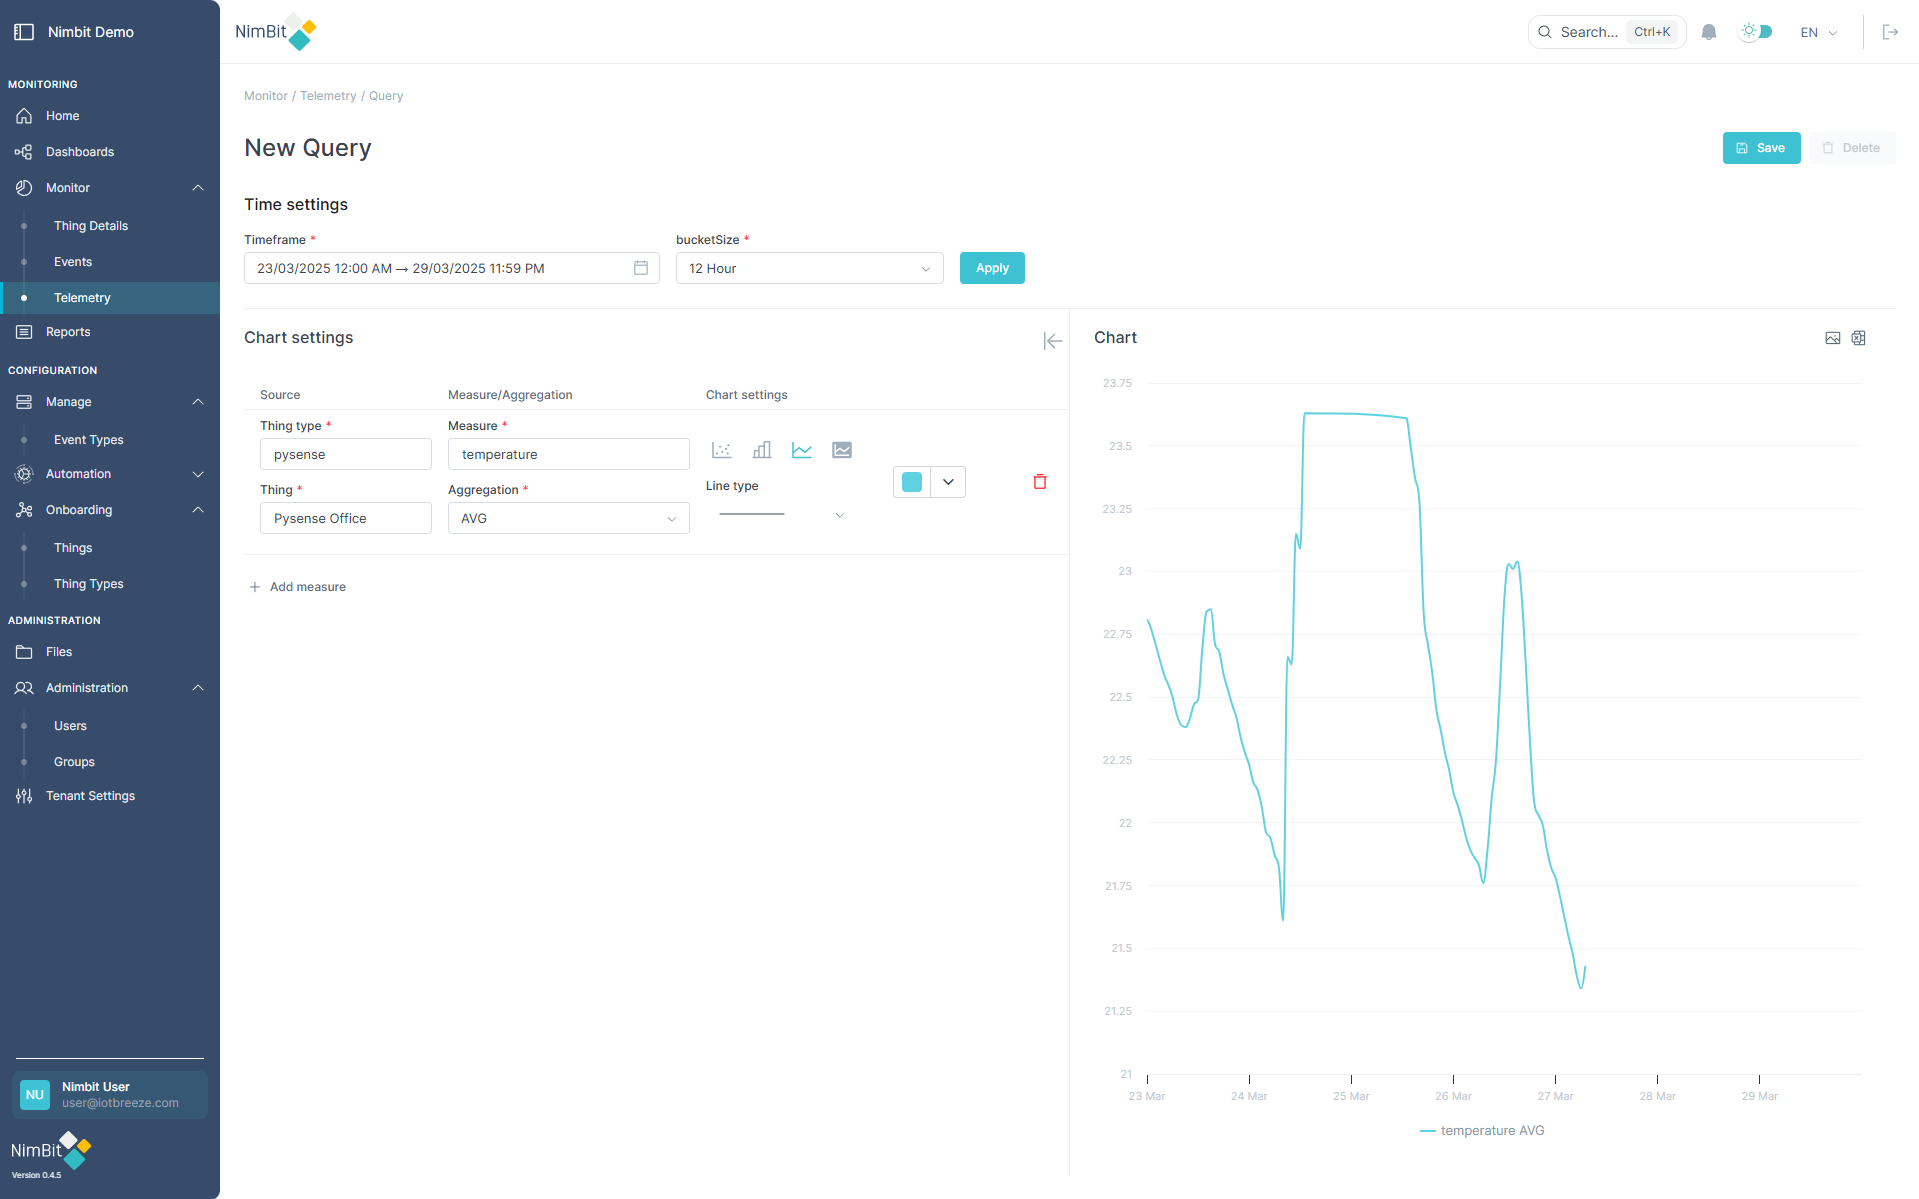
Chart Configuration
In the Chart Settings section:
- Click "Add Measure" to begin adding data series.
- For each measure, define:
- ThingType
- Things
- Measure
- Thing
- Aggregation method
- Chart Type: Choose from dots, bar, line, or area
- Color: Set a custom color for distinction
Each measure can have a unique chart type and color, allowing rich and clear data presentations.
Once configuration is complete, click "Save" to store the view.
You will be prompted for a name and also groups to select. Both are required.
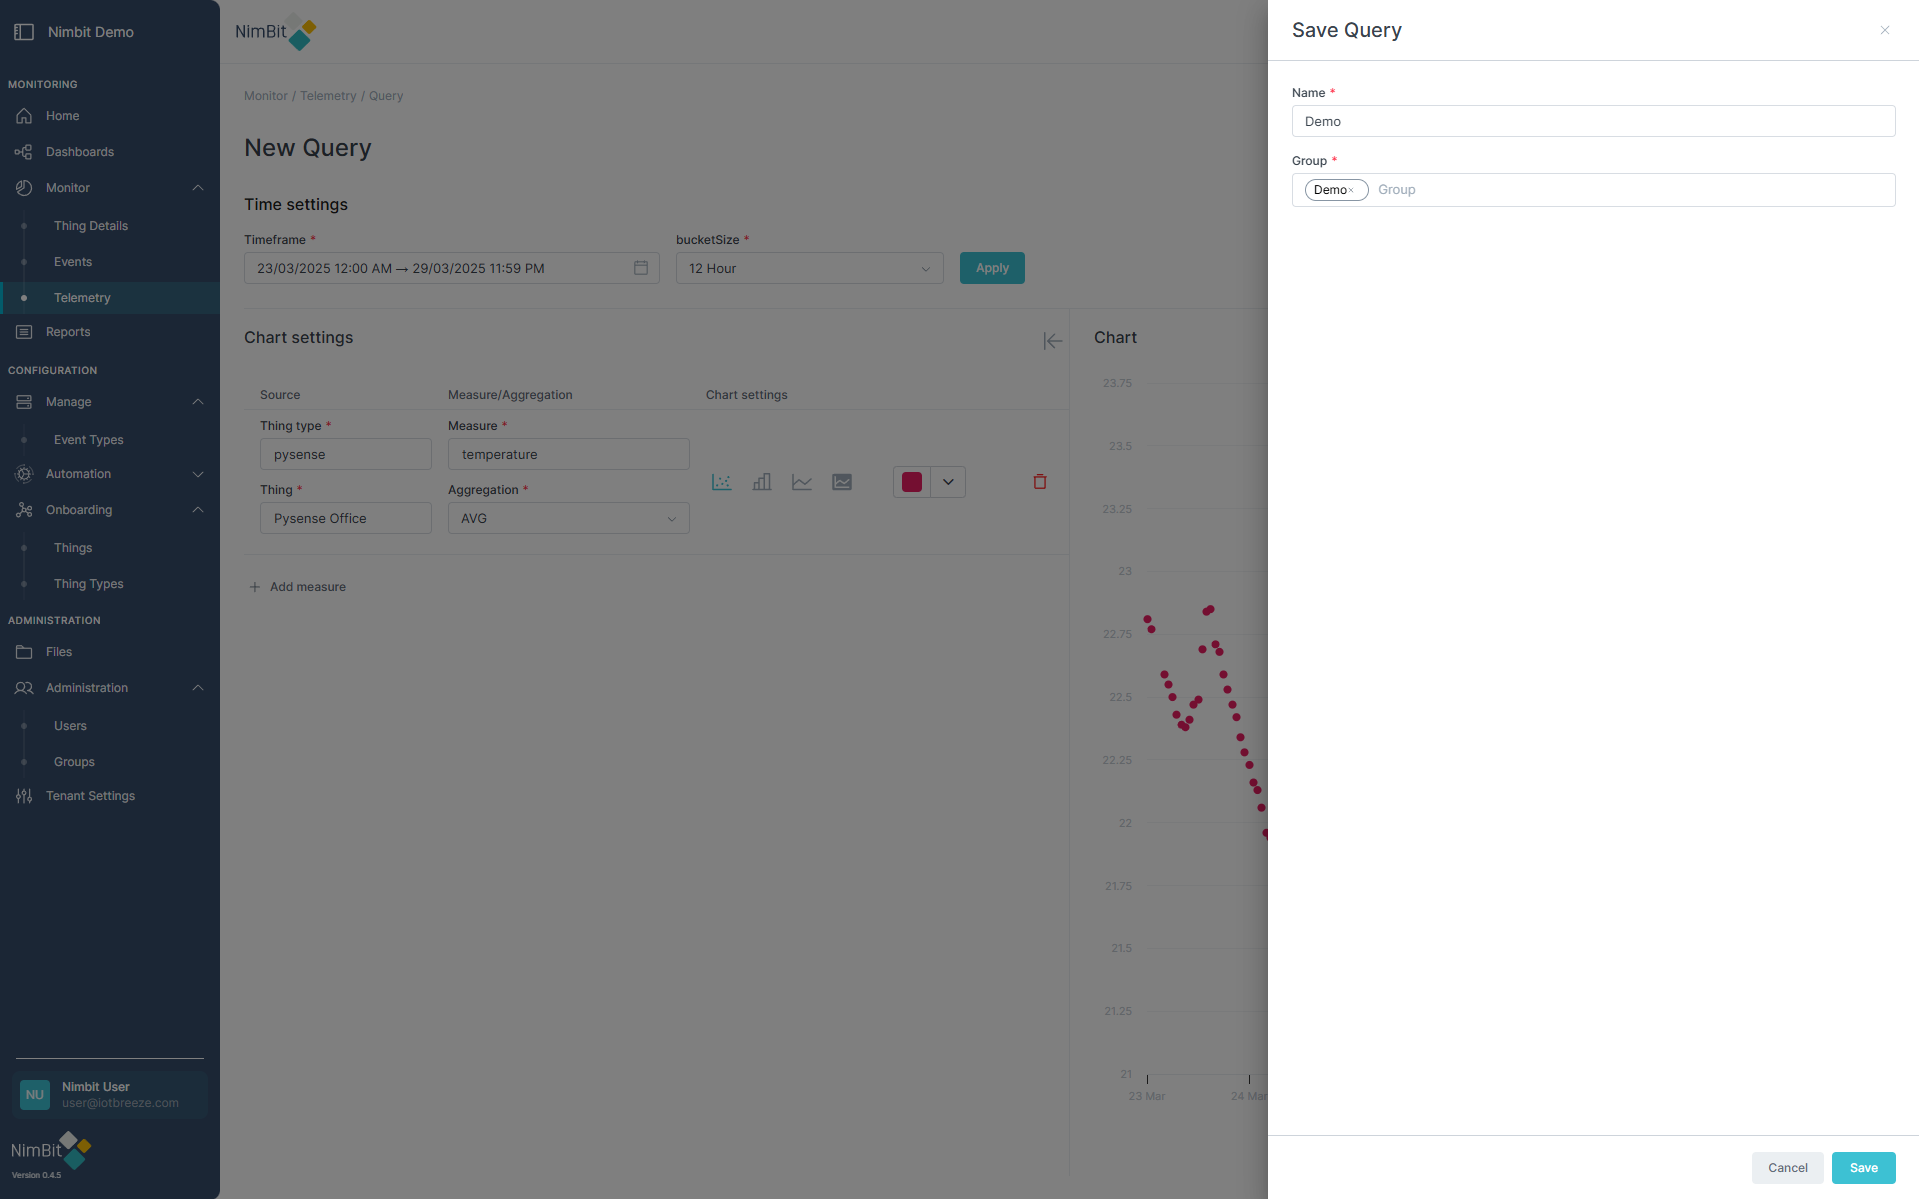
Hit Save again to finally save the new telemetry.
Working with Telemetry Charts
Telemetry views display time-series charts according to your configuration. Charts are interactive and support various tools for analysis and customization.
Expand Mode
Expand charts to the full width, hiding the config section for detailed inspection:
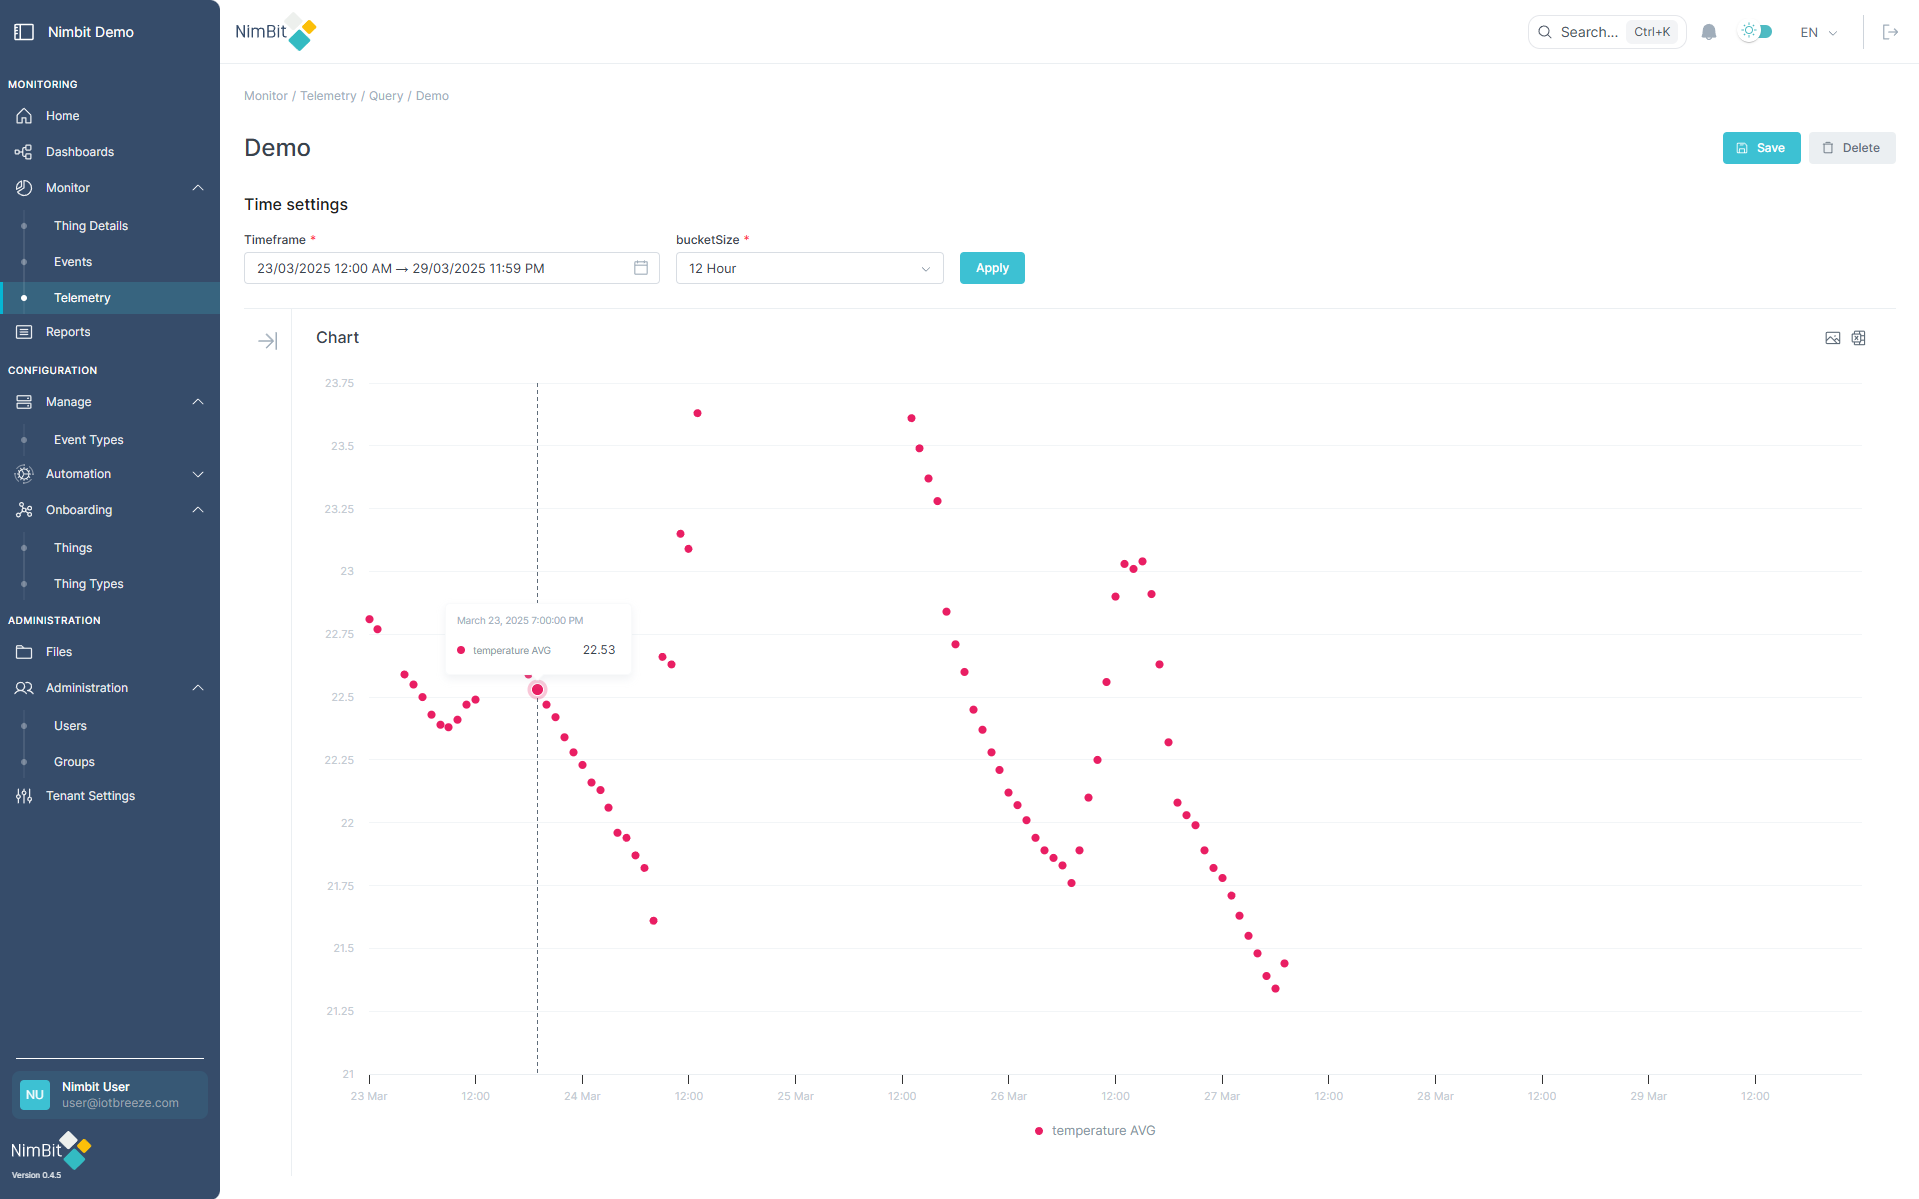
Zooming and Export Options
- Zoom: Hold the left mouse button and mark the area you want to zoom into.
- Download Graph Image: Use the button on the right to export the currently visible graph as an image.
- Download Excel Data: Use the adjacent button to download the currently selected data as an Excel file.